Support
EBM Calculator is available on iOS devices running iOS 18.1 or later. It is optimized for iOS 26 on iPhones, but will also run on iPads and Apple Silicon Macs.
You can save up to 100 results.
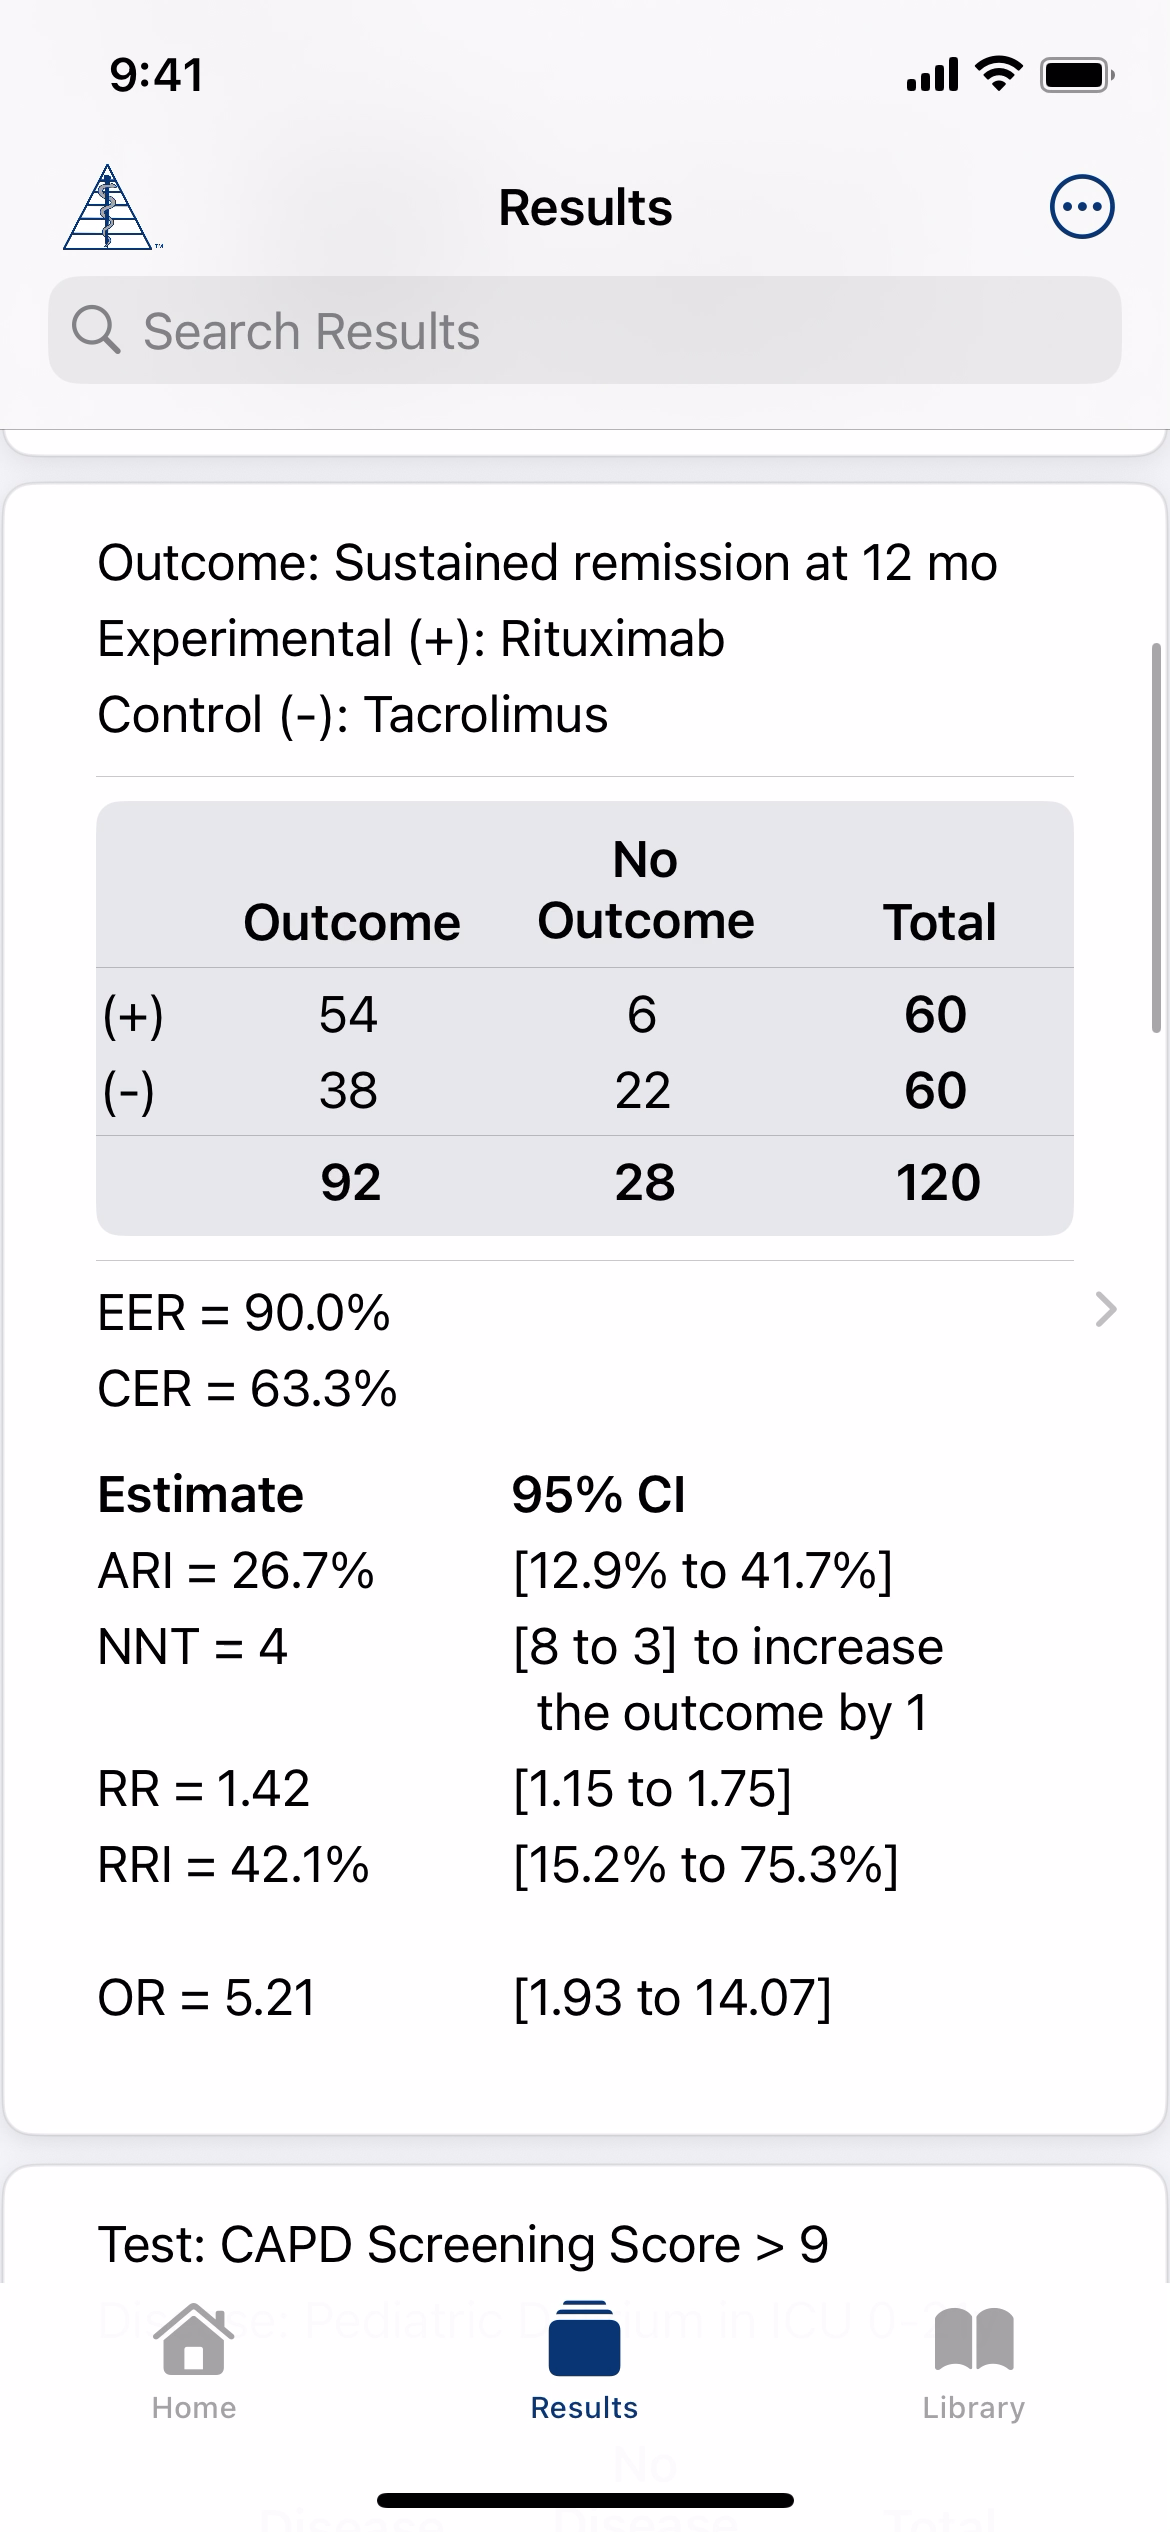
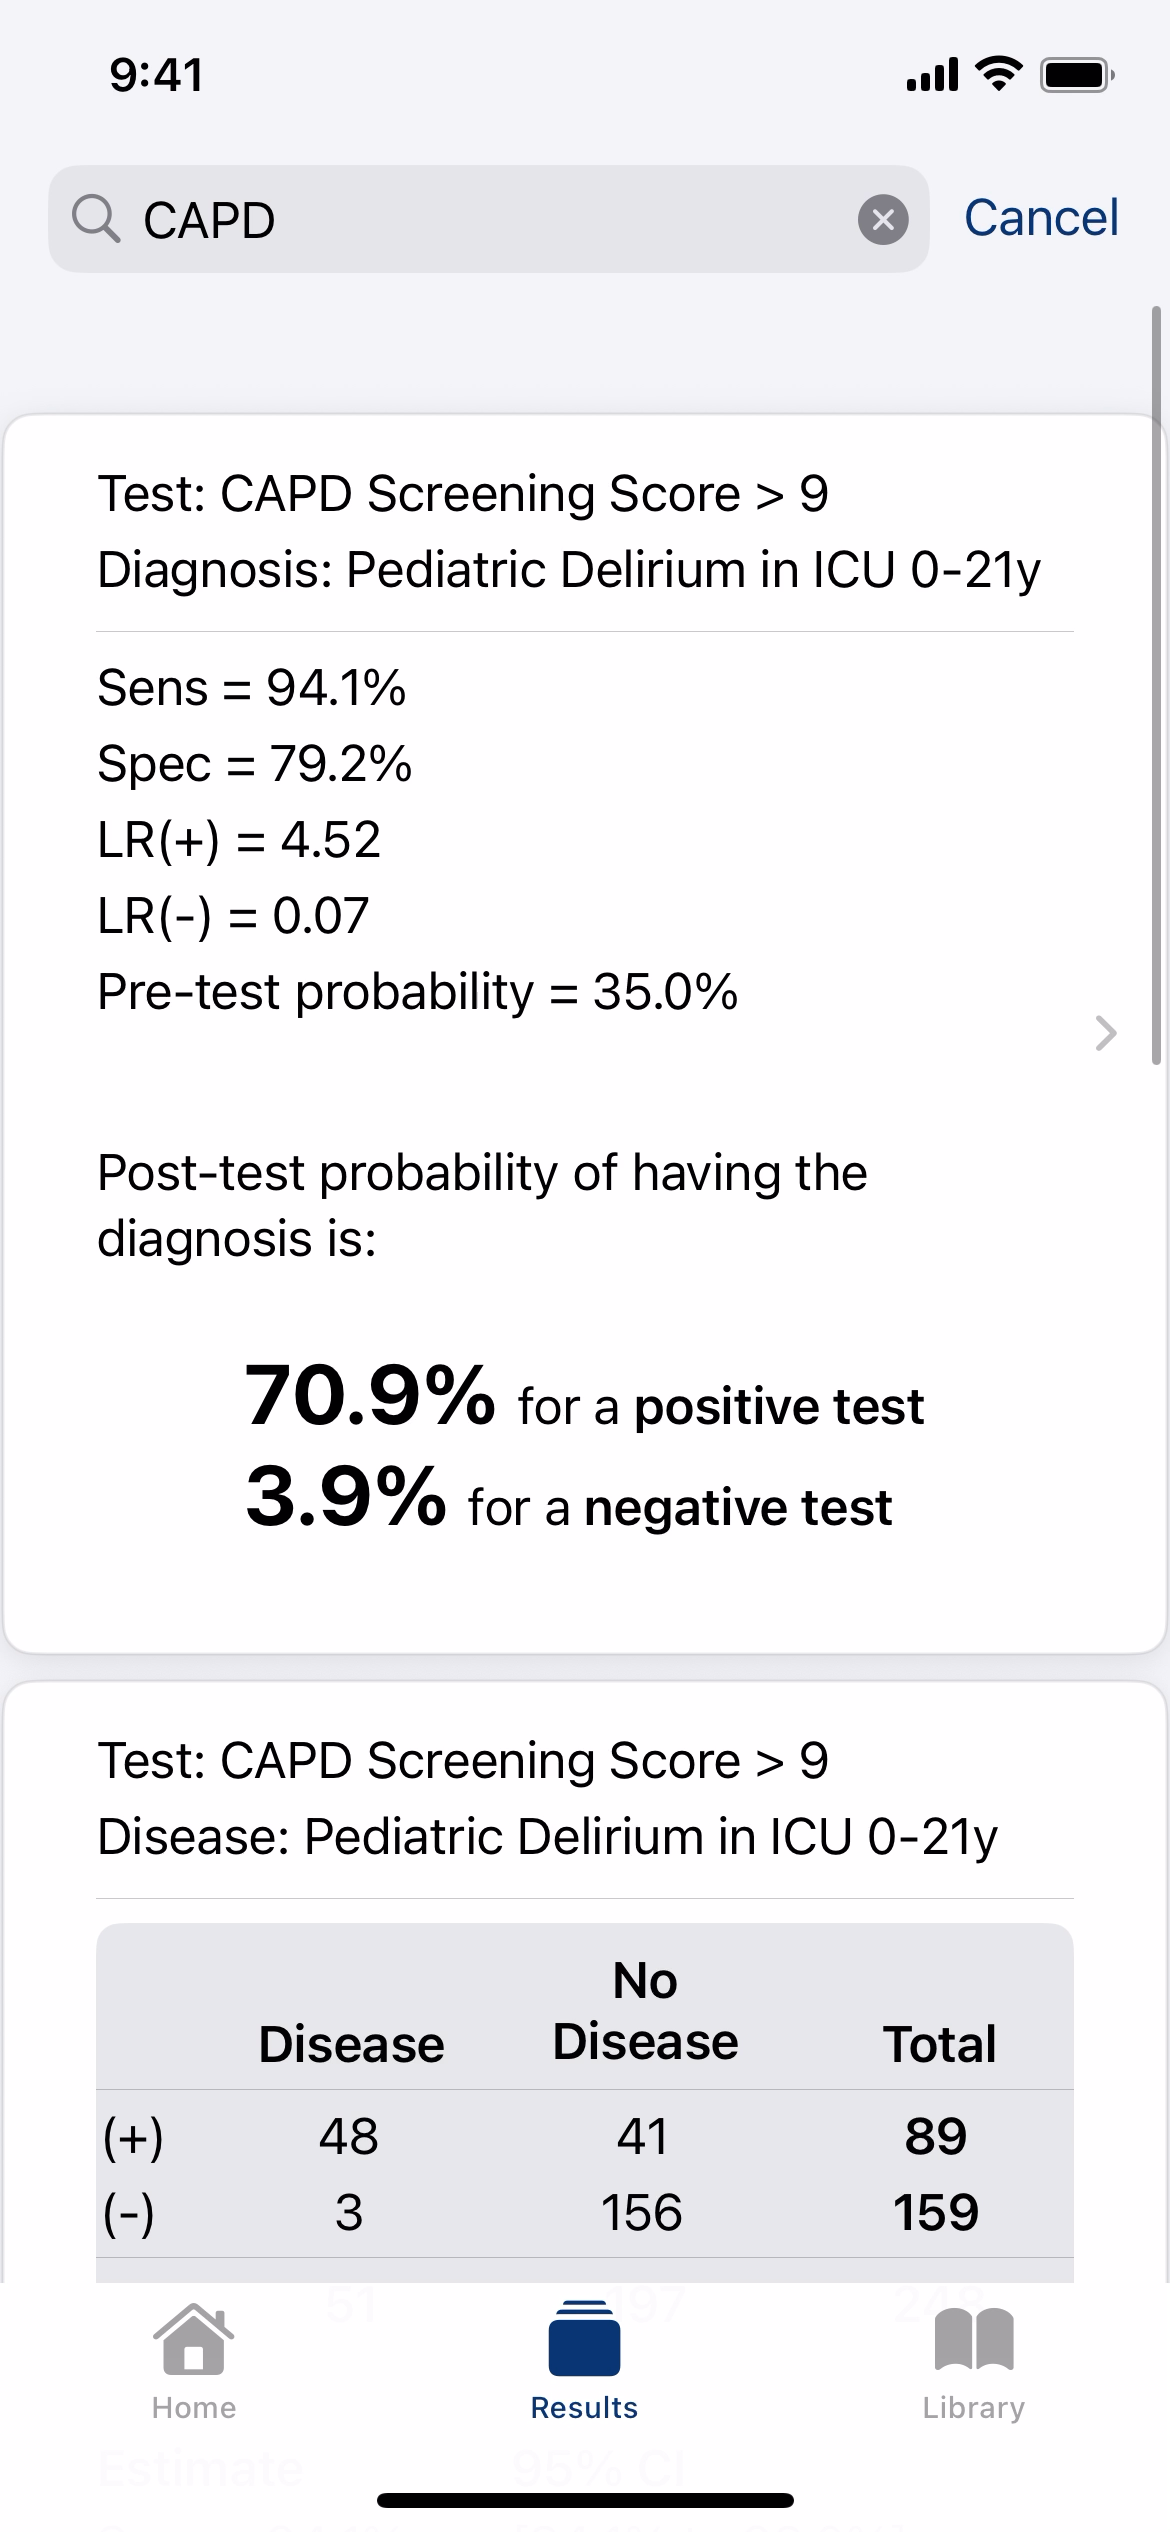
From the Results tab, you can also:
- Search through saved results using keywords or citation info
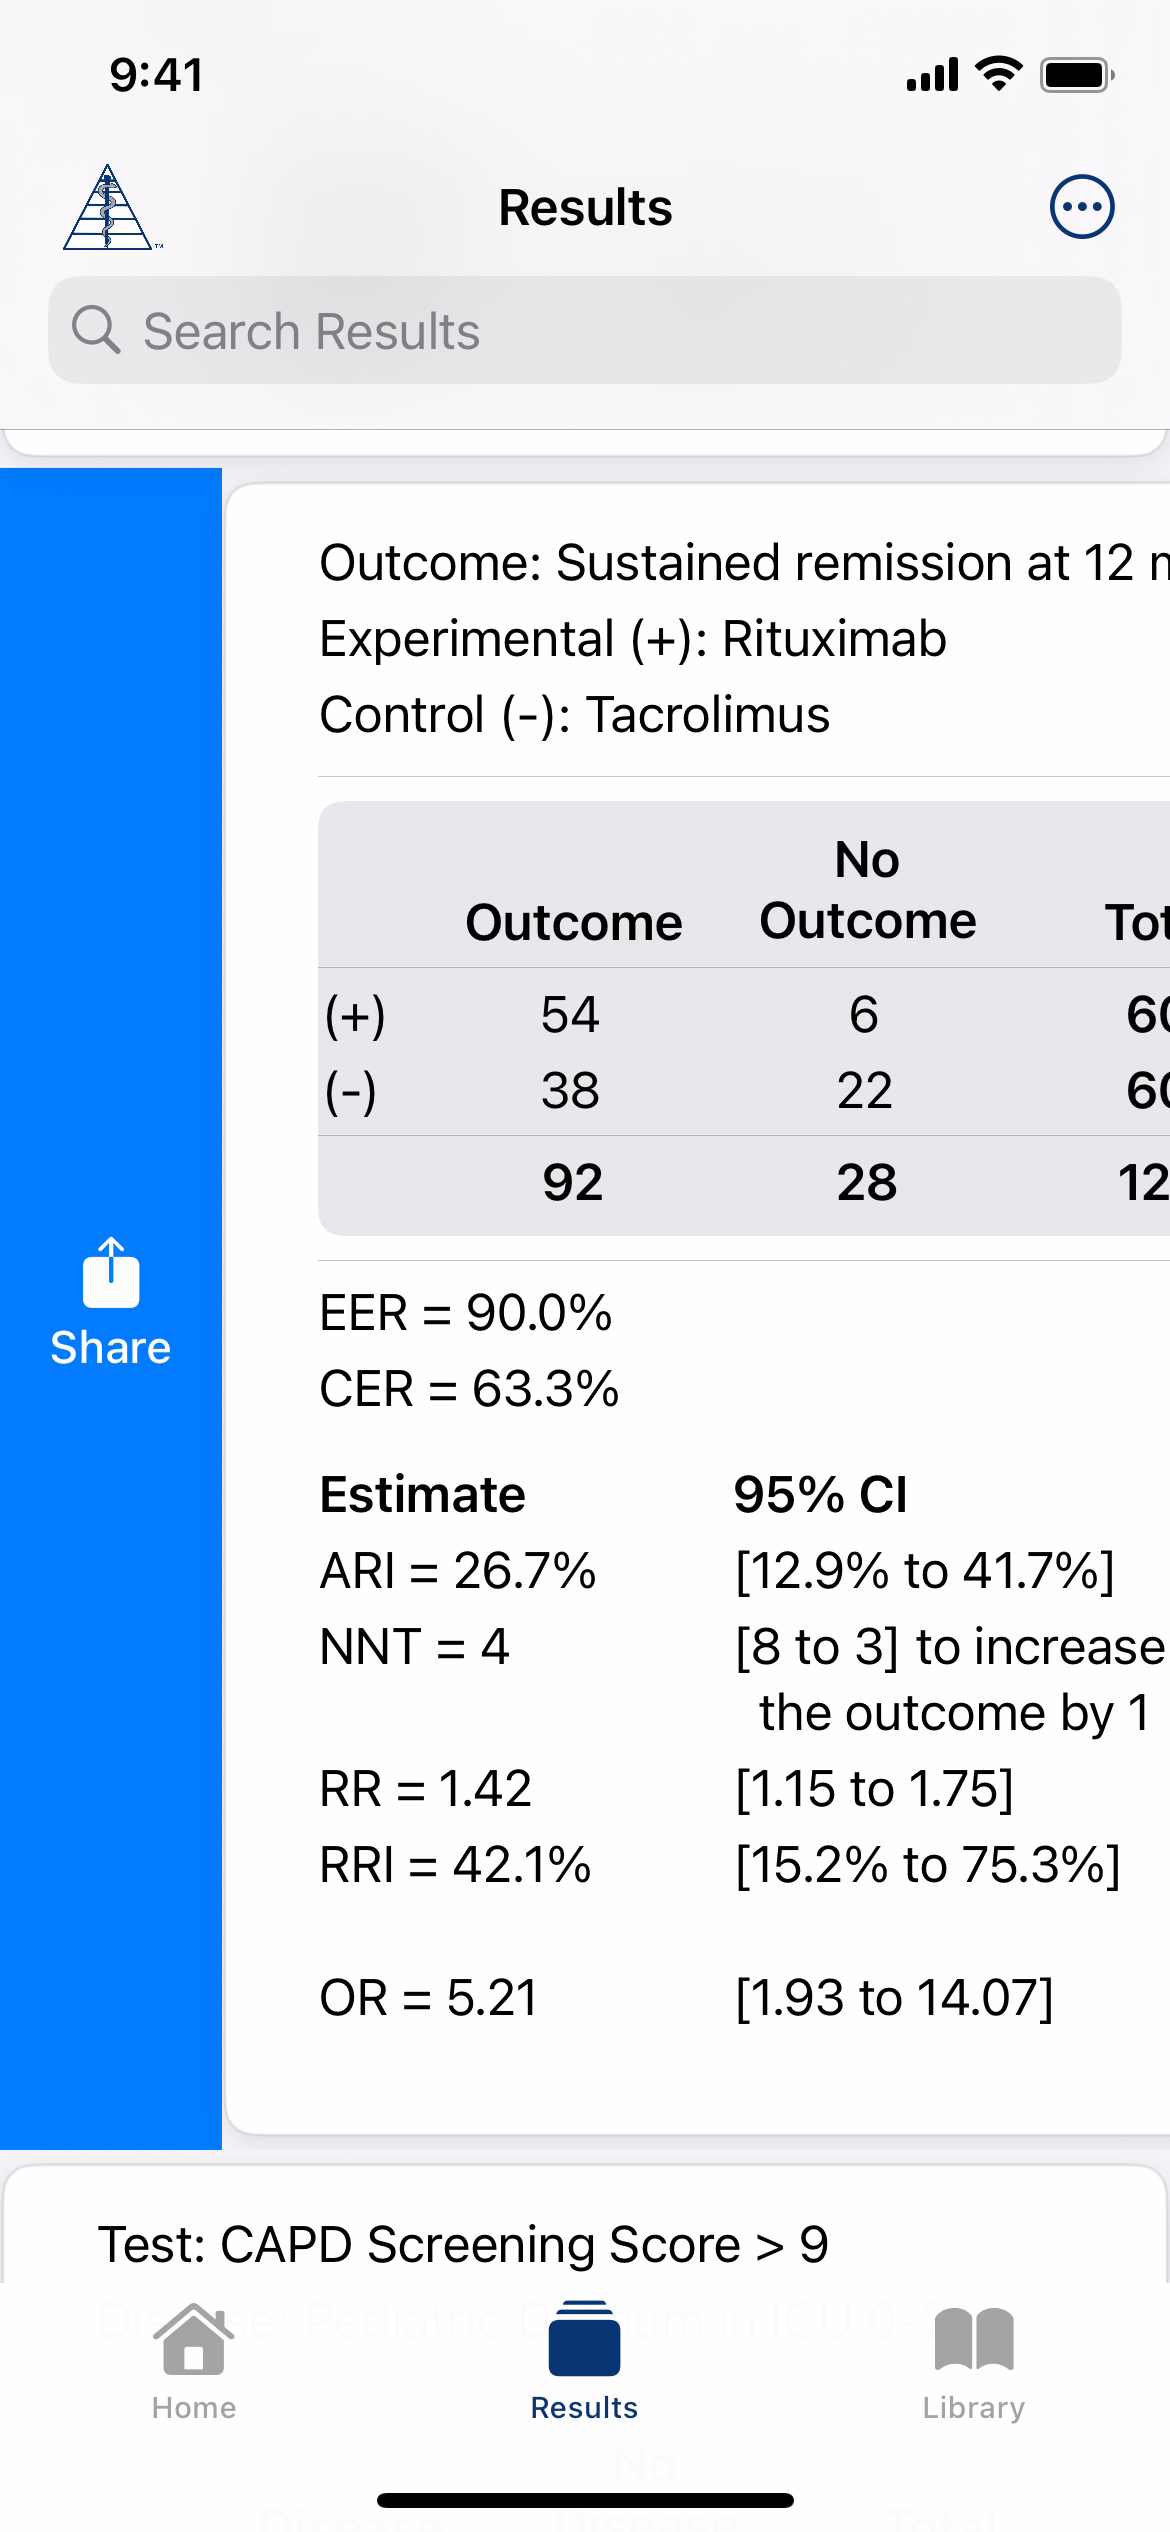
- Share results by swiping right
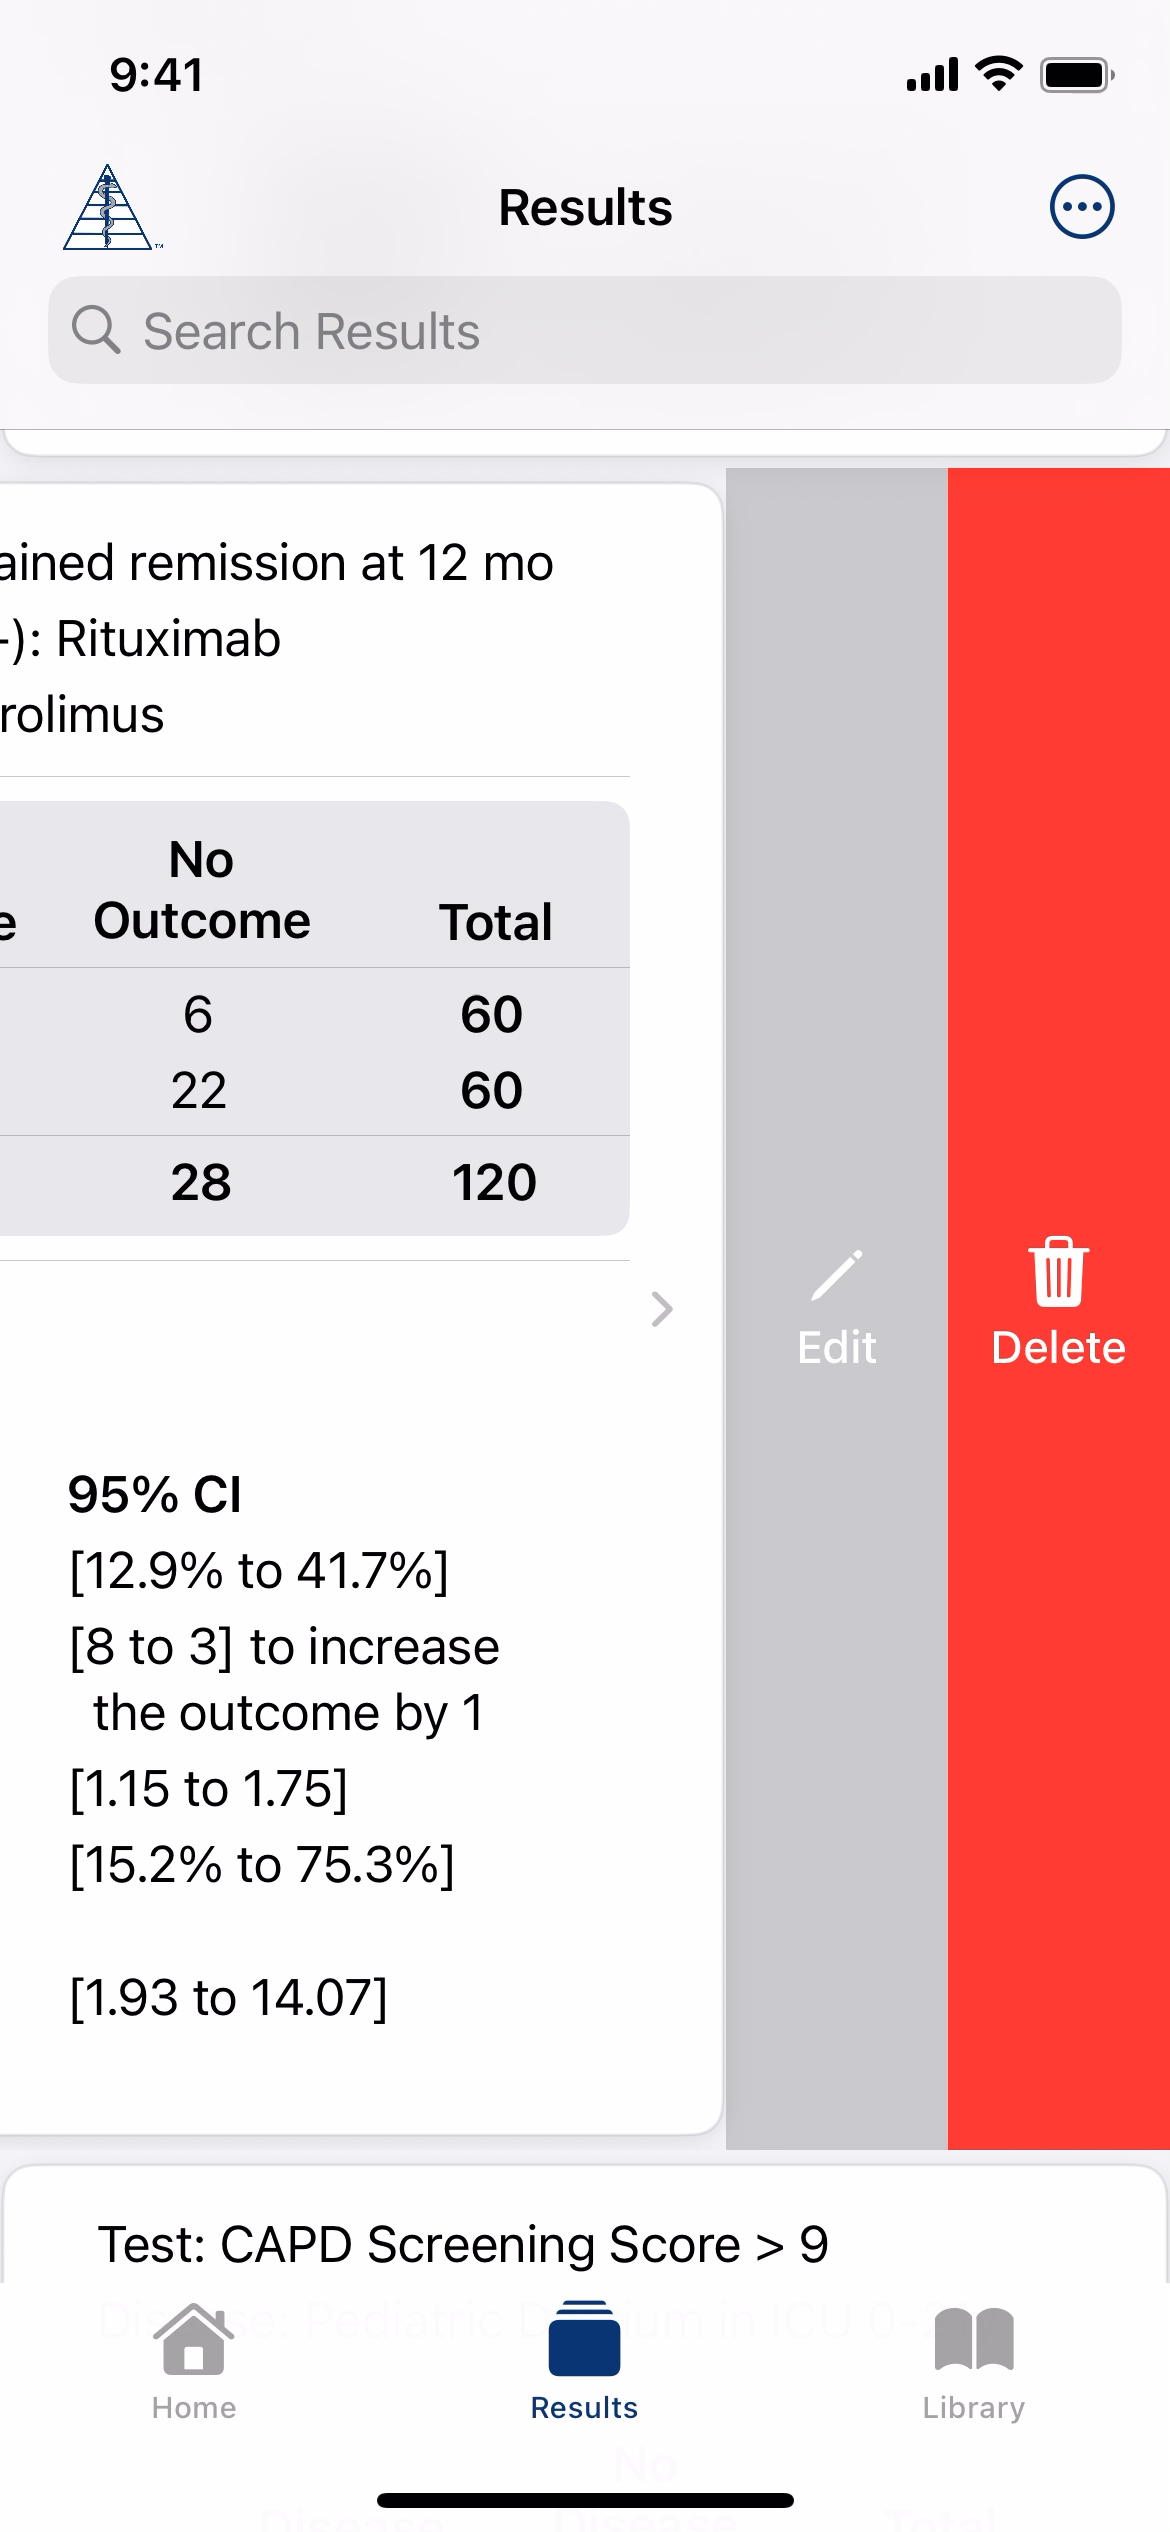
- Edit individual results by swiping left
- Reorder results by pressing and dragging
- Delete individual results by swiping far left
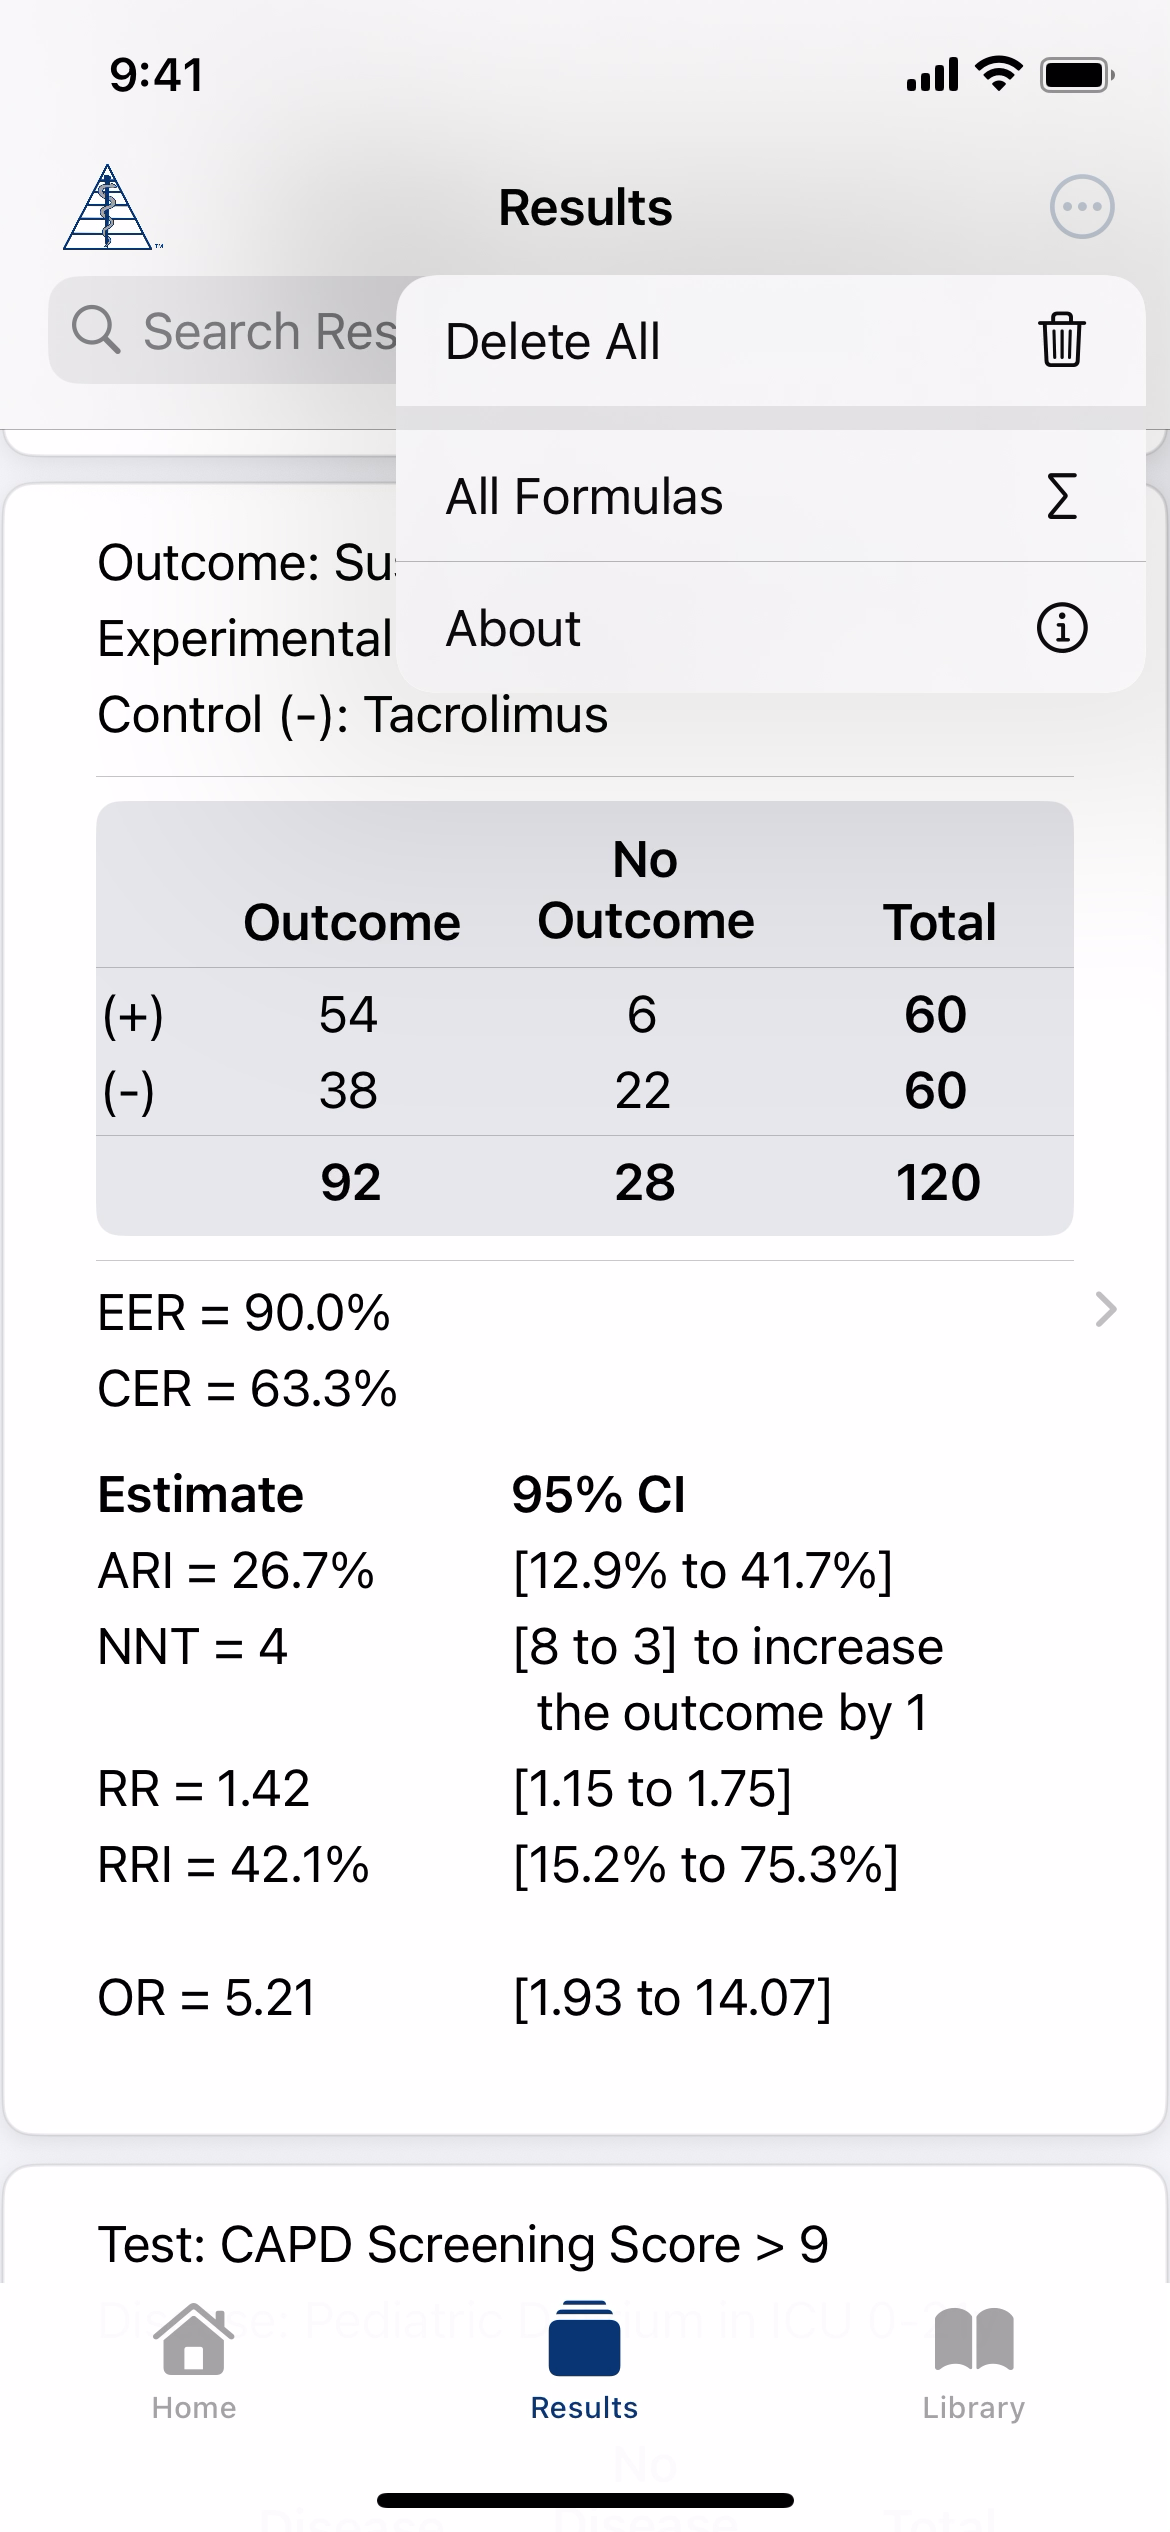
- Delete all saved results from the menu button
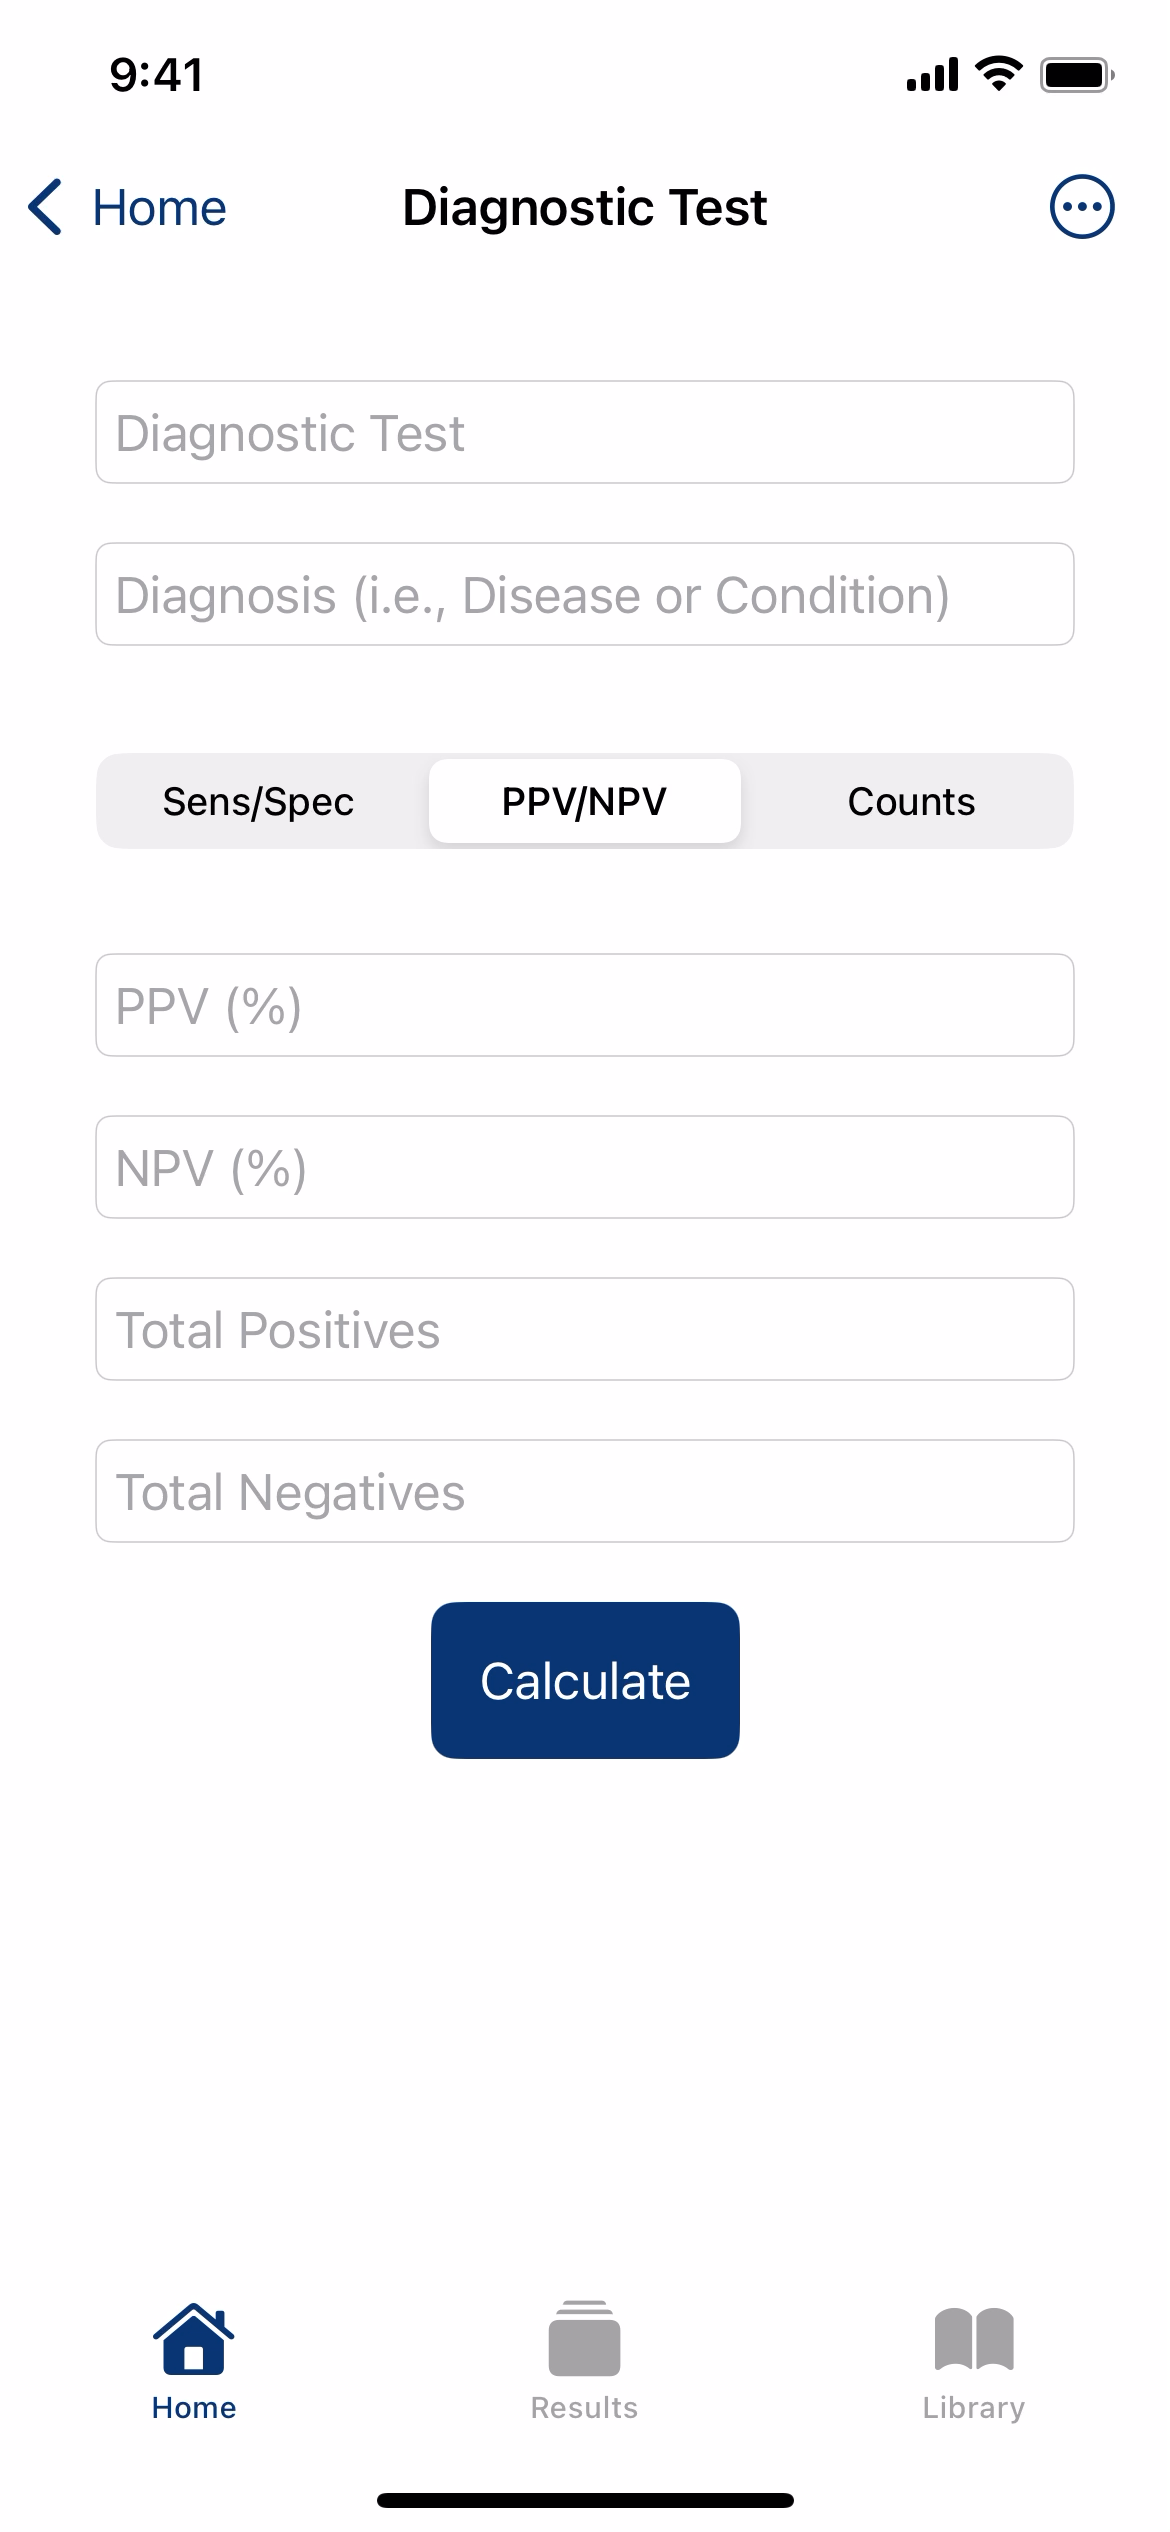
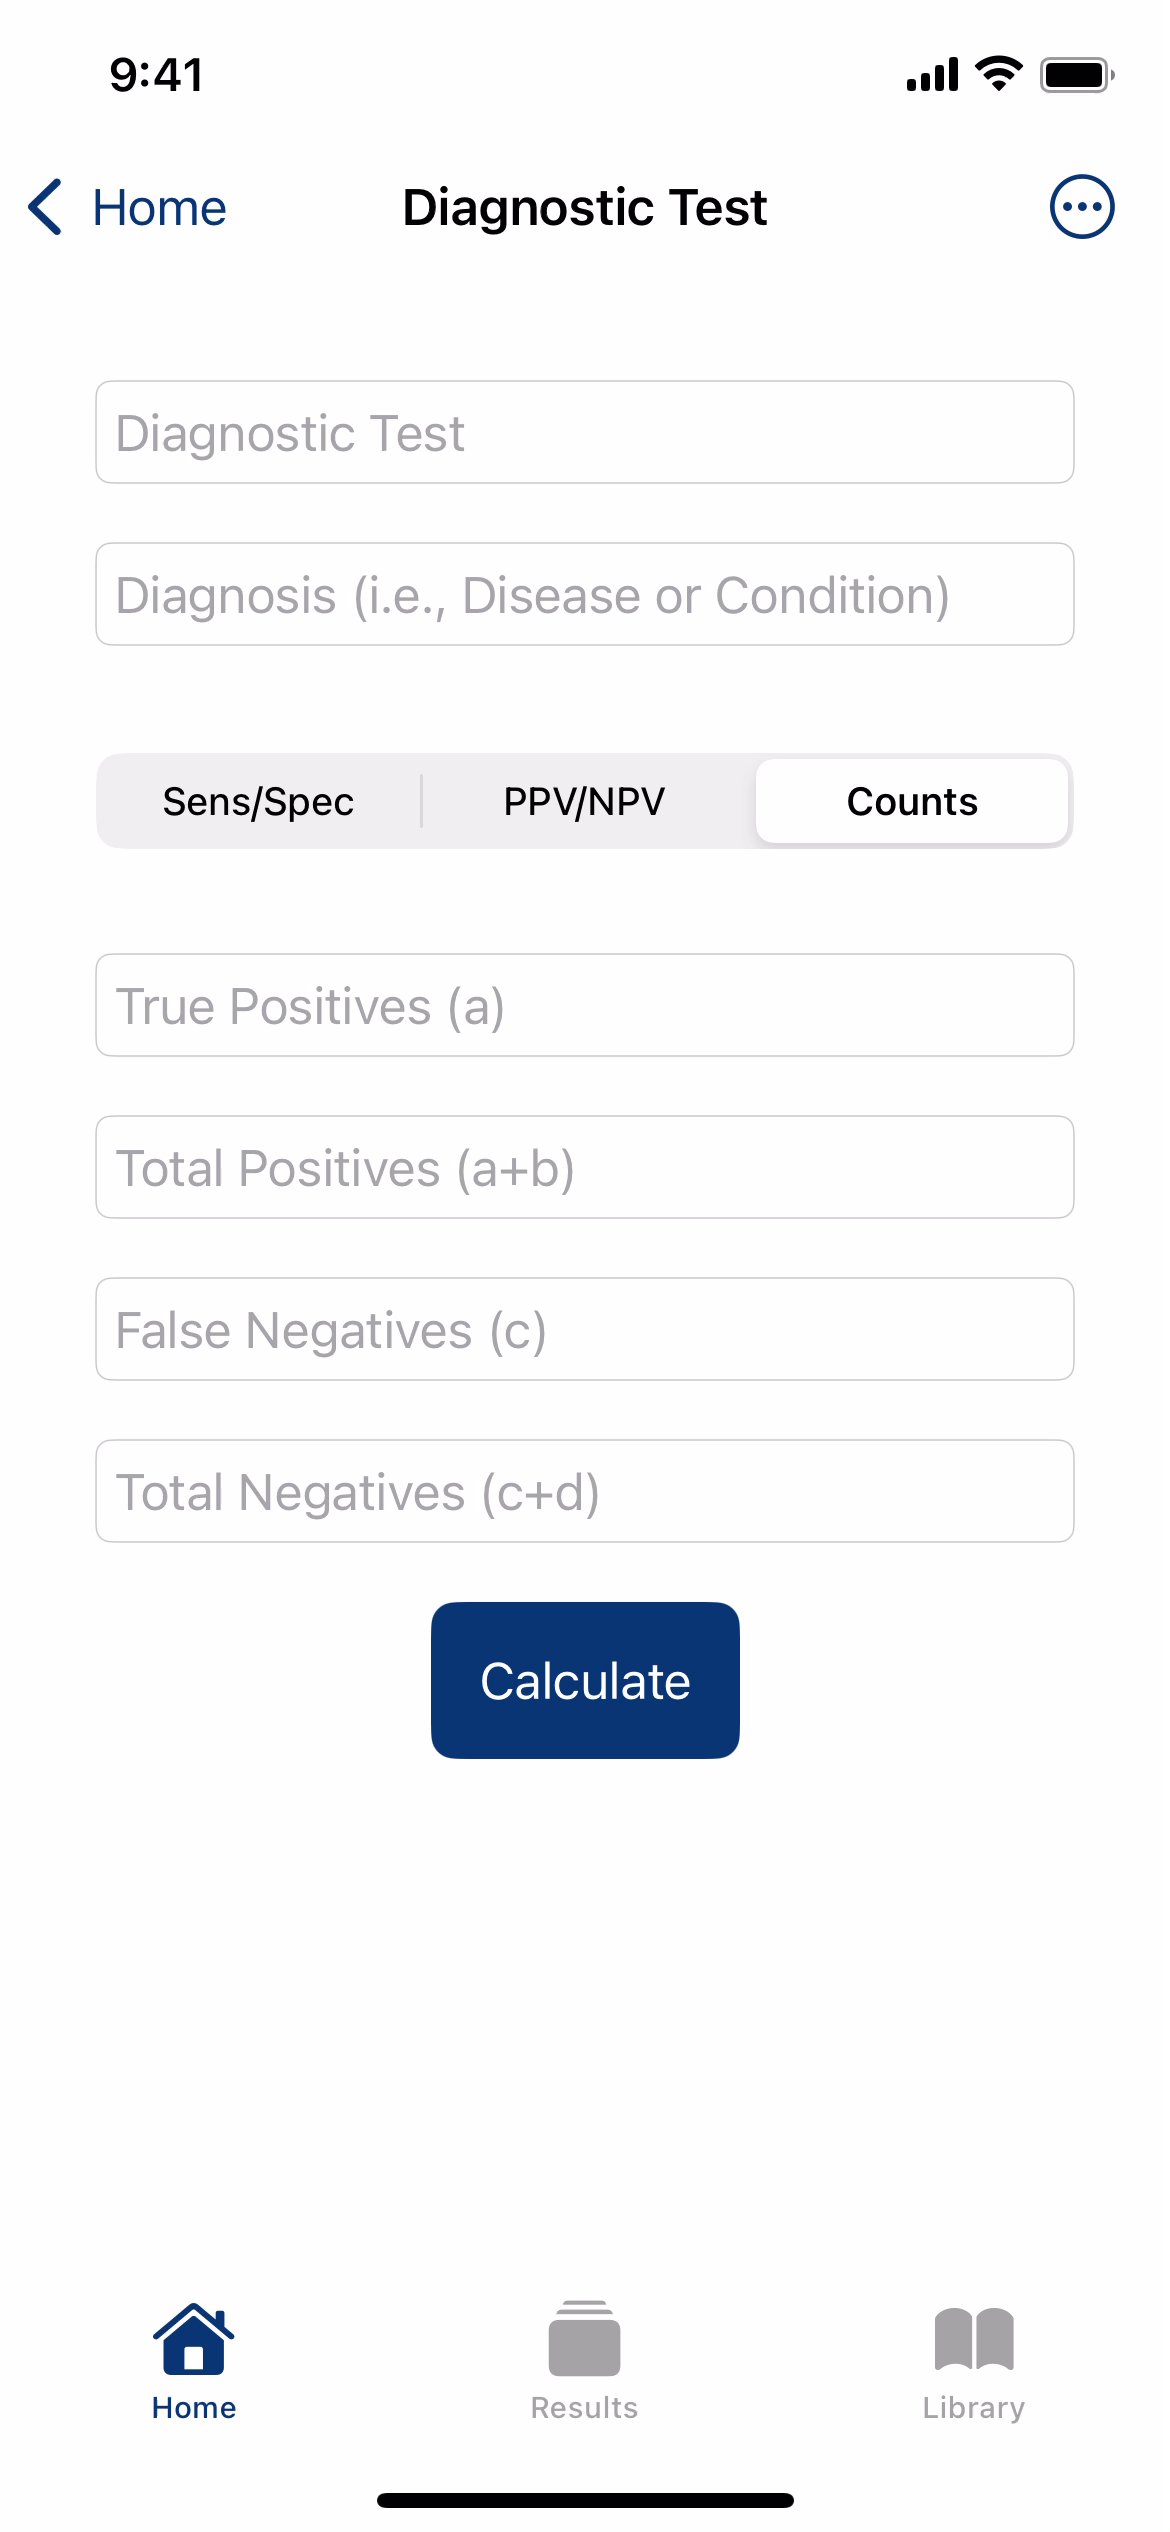
Each calculator offers different input options to match how authors commonly report their results. Choose the one that best fits your study.
For example, if the study only provides PPV and NPV (and not sensitivity or specificity), select PPV/NPV as your input method.
Click here to review the formulas used for calculating all metrics and confidence intervals in the app.
I got tired of jumping between different online calculators just to interpret study results, so I built the EBM Calculator to streamline the process and make evidence appraisal simpler for all of us.
The app has come a long way since I first started developing it, but the goal remains the same: to provide a purposefully simple tool that helps you assess the strength of an association (for therapies or exposures), evaluate diagnostic test performance, and calculate post-test probability.
Yes! The more I learn, the more features I want to build. But I also wanted to release the app quickly to start helping clinicians.
If you have suggestions for new features or improvements, please email me at support@ebmcalculator.com.
If you're interested in testing new features before they're released, see below!
If you're interested in testing new features before they’re released, I'd love your help! You can sign up below to be included in future beta versions of EBM Calculator — or, if you prefer, just send an email to beta@ebmcalculator.com and I'll add you to the list.
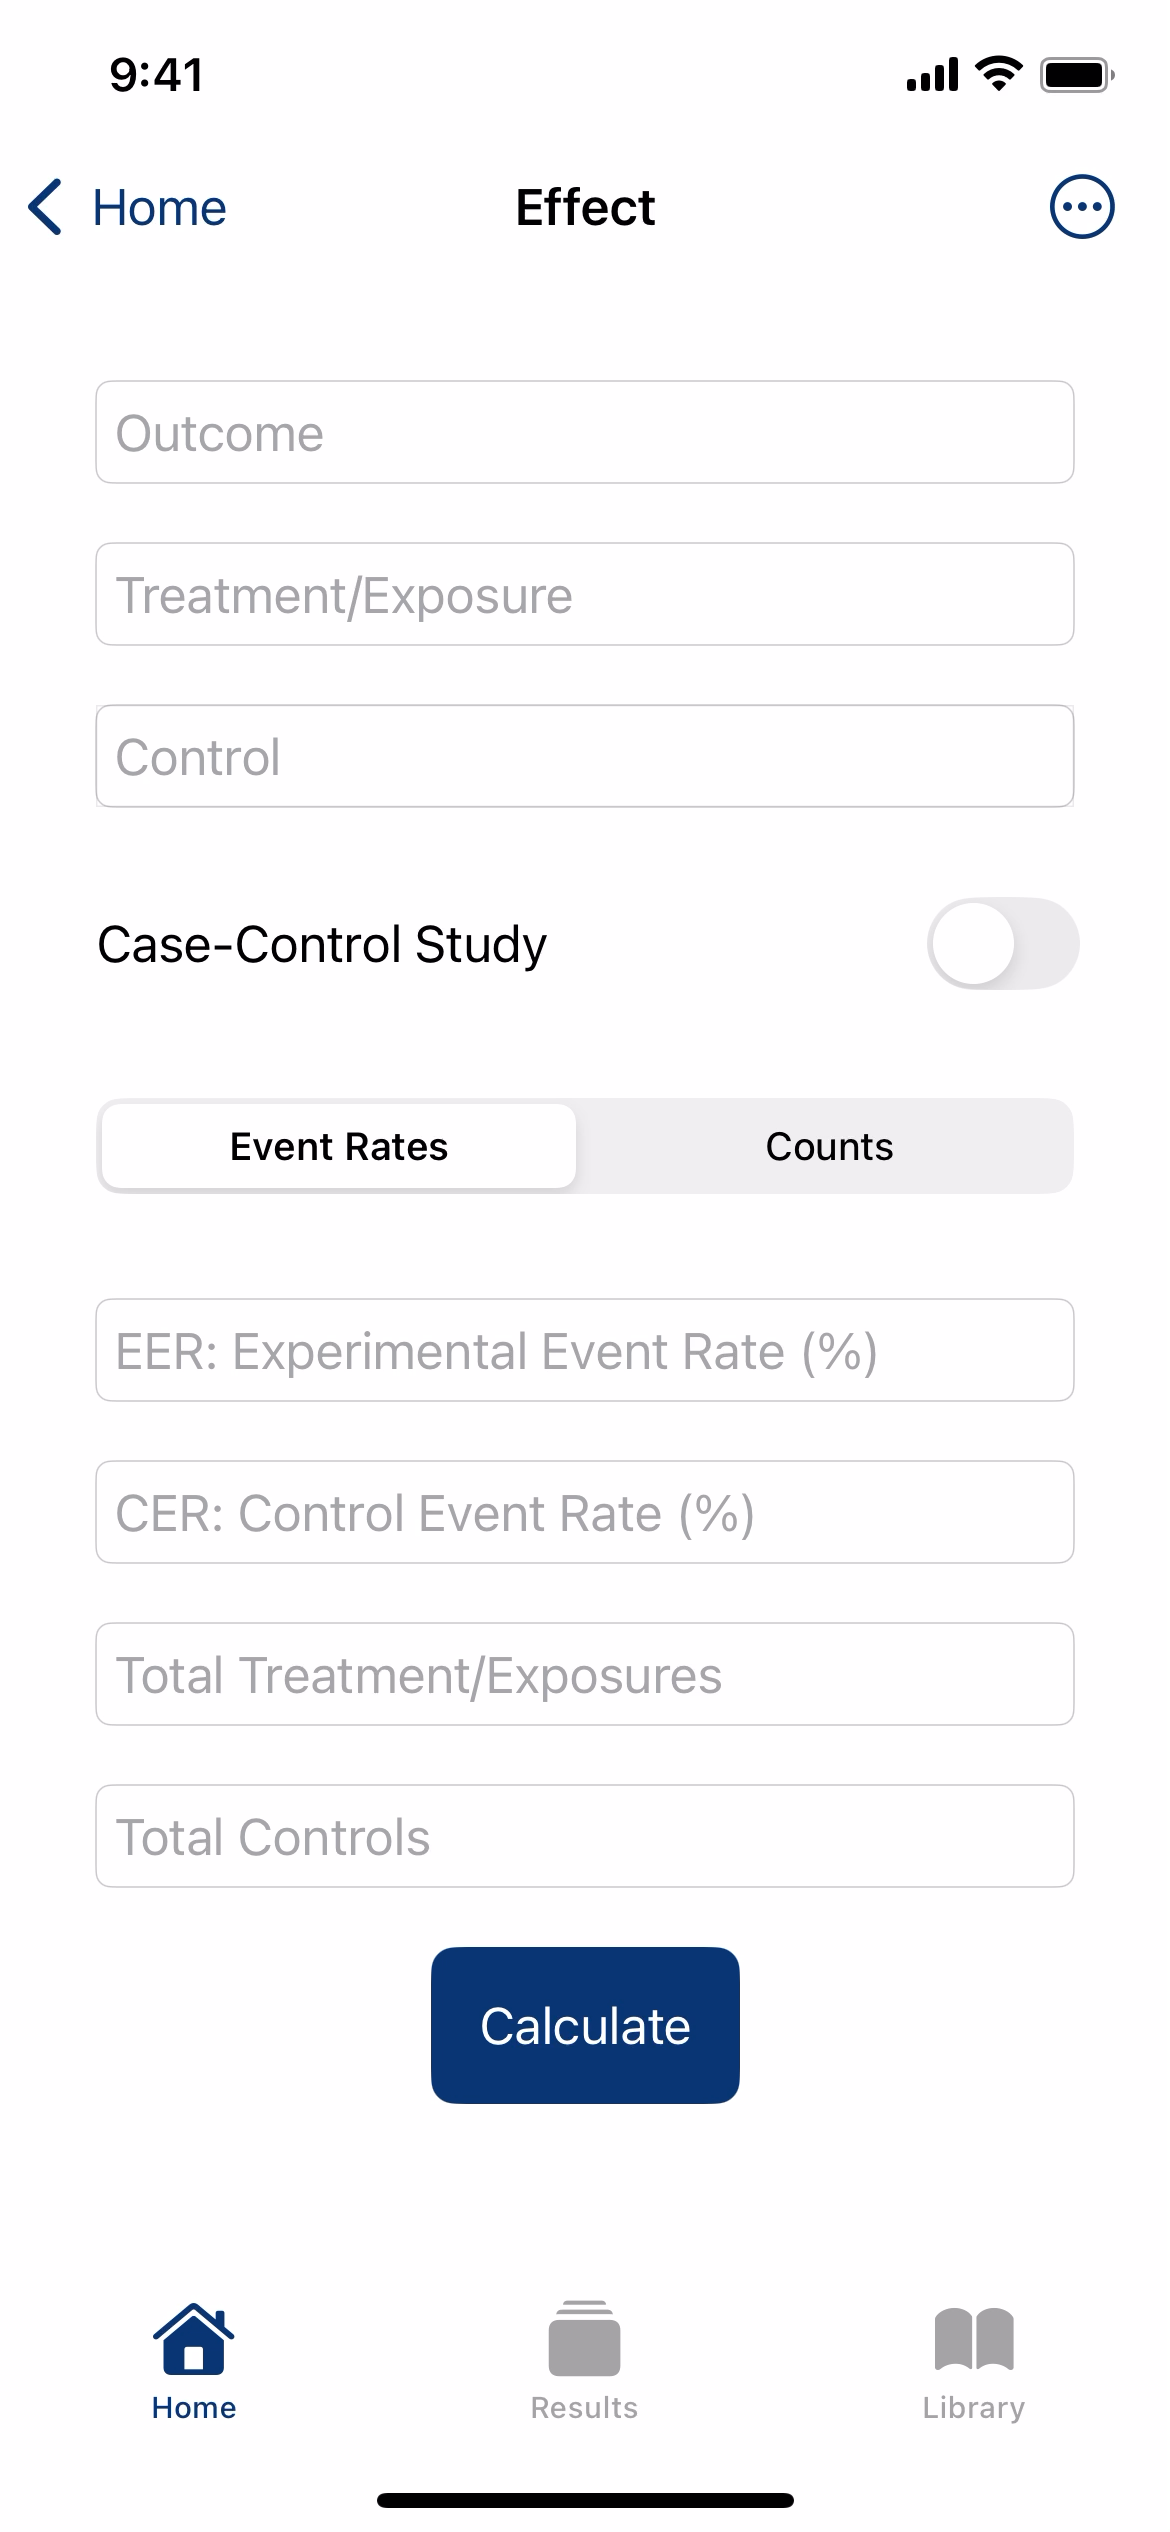
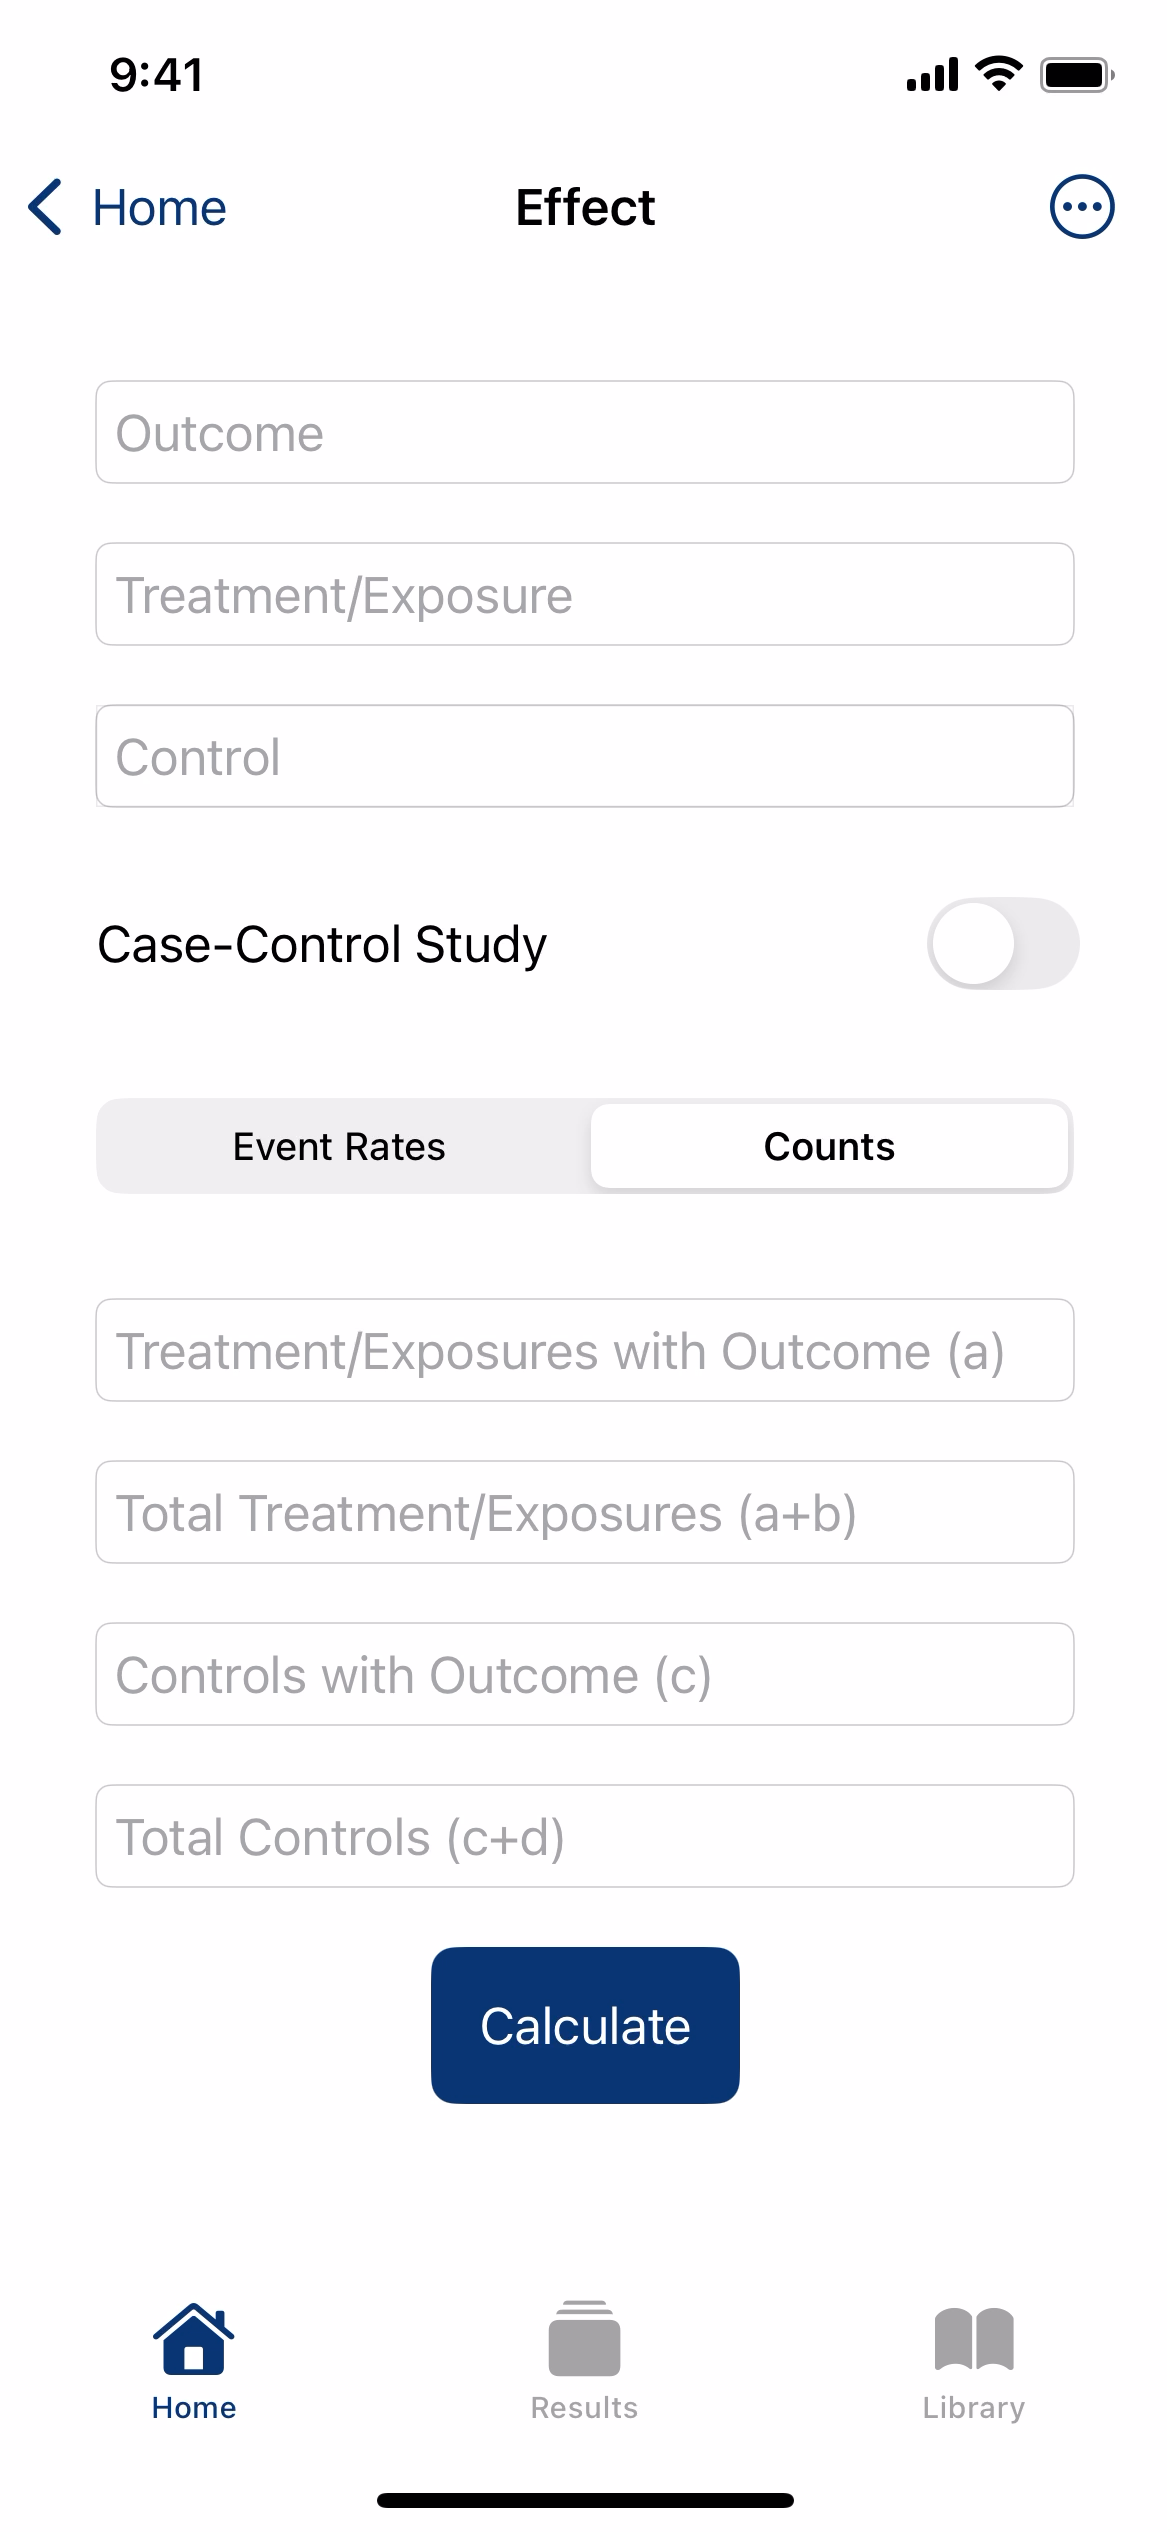
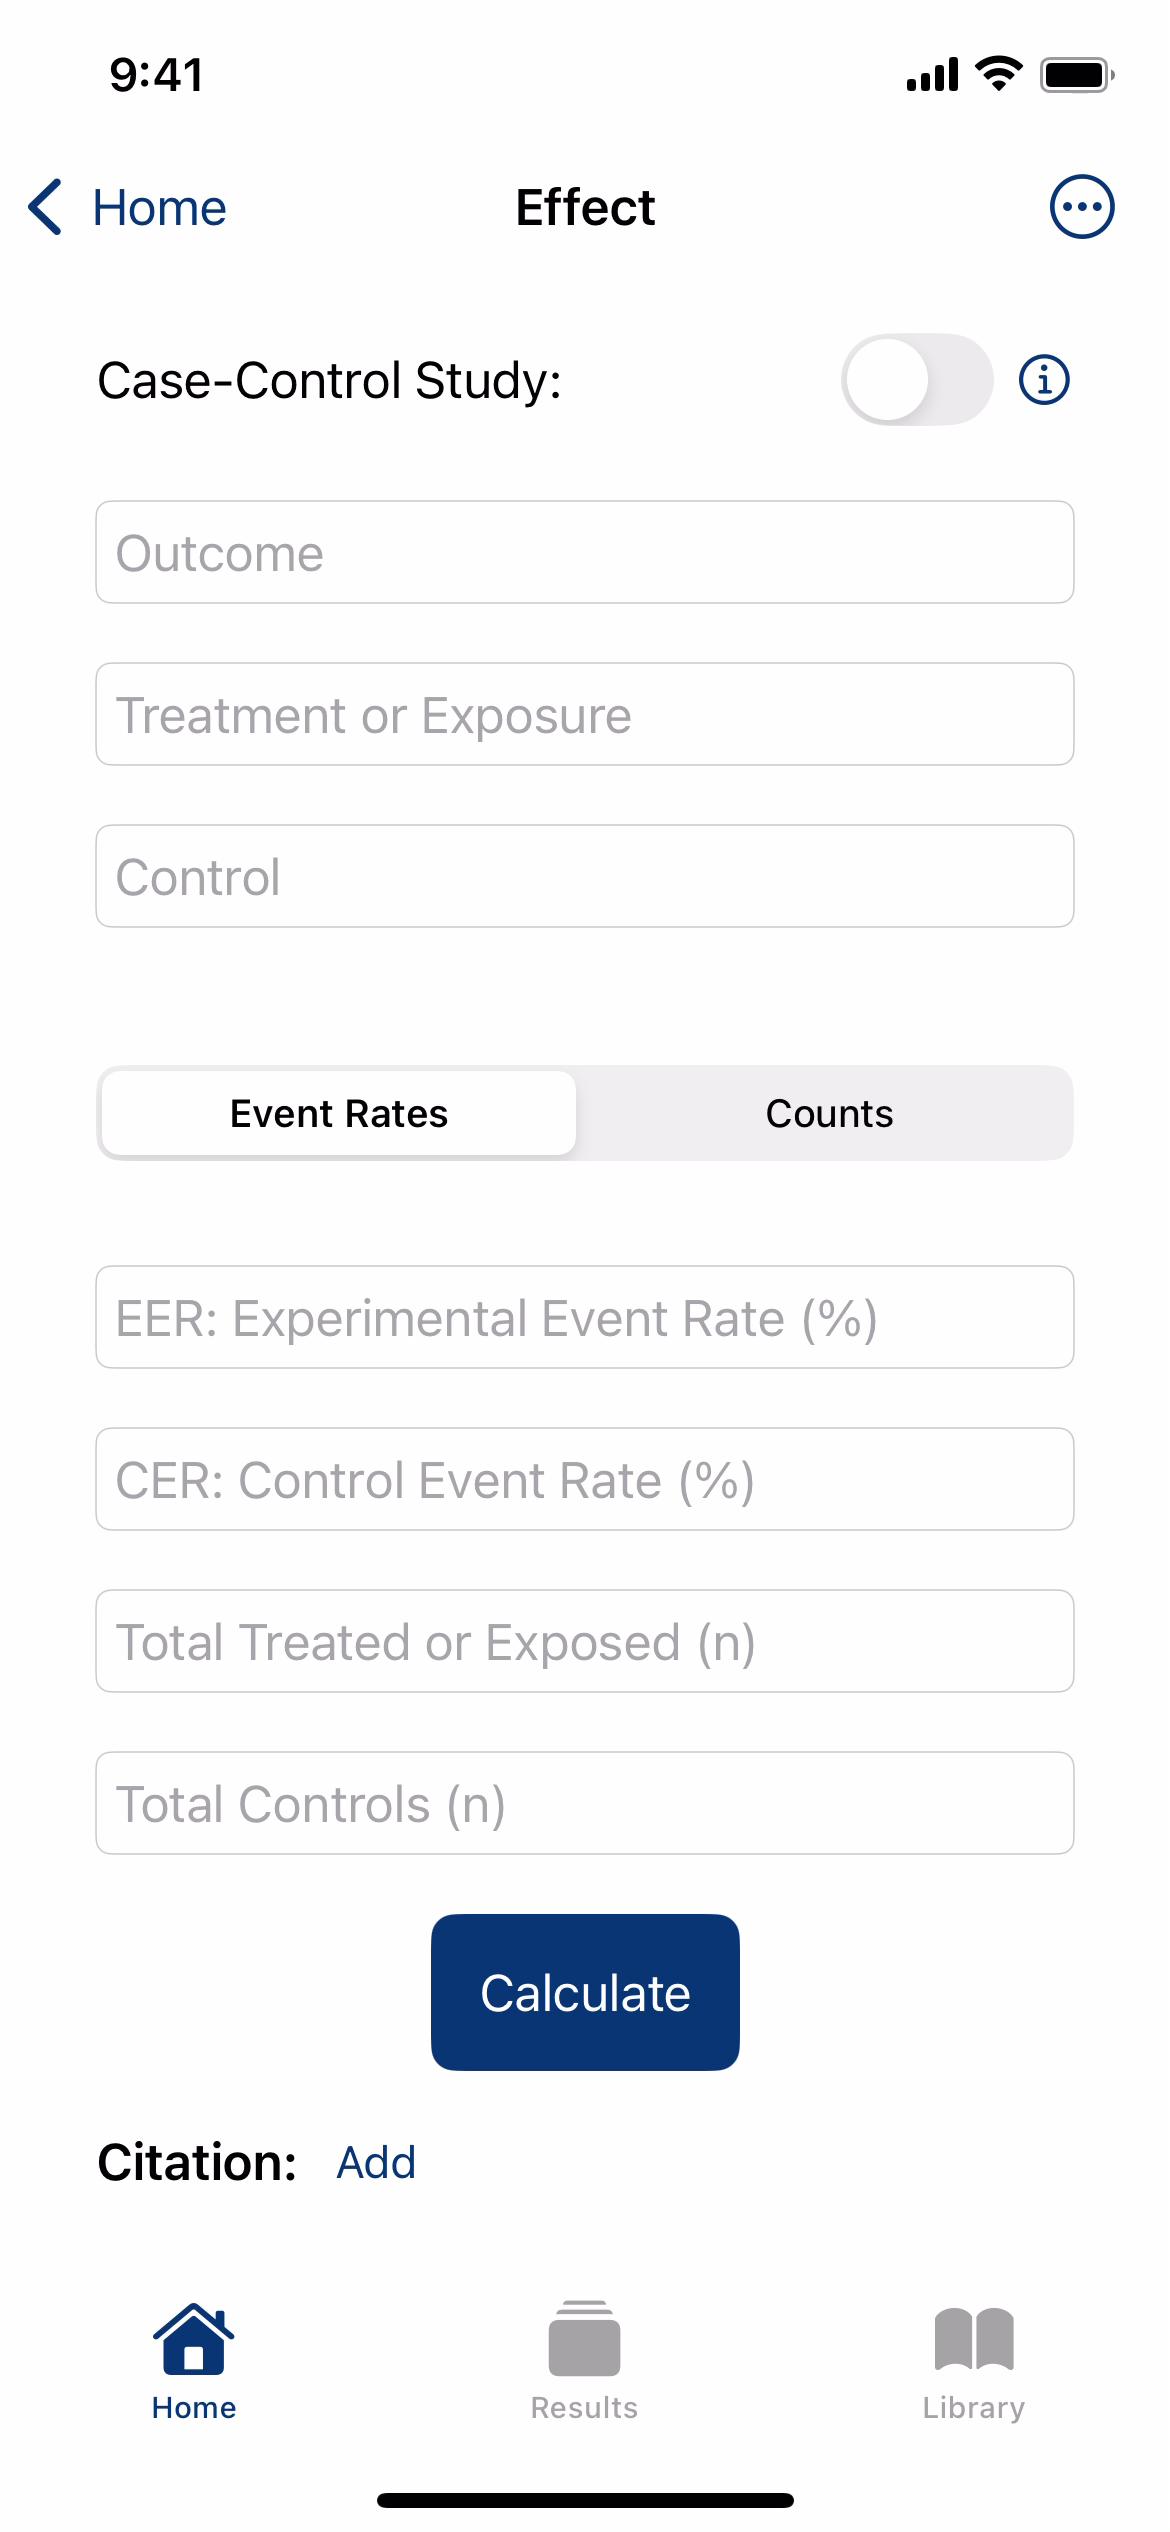
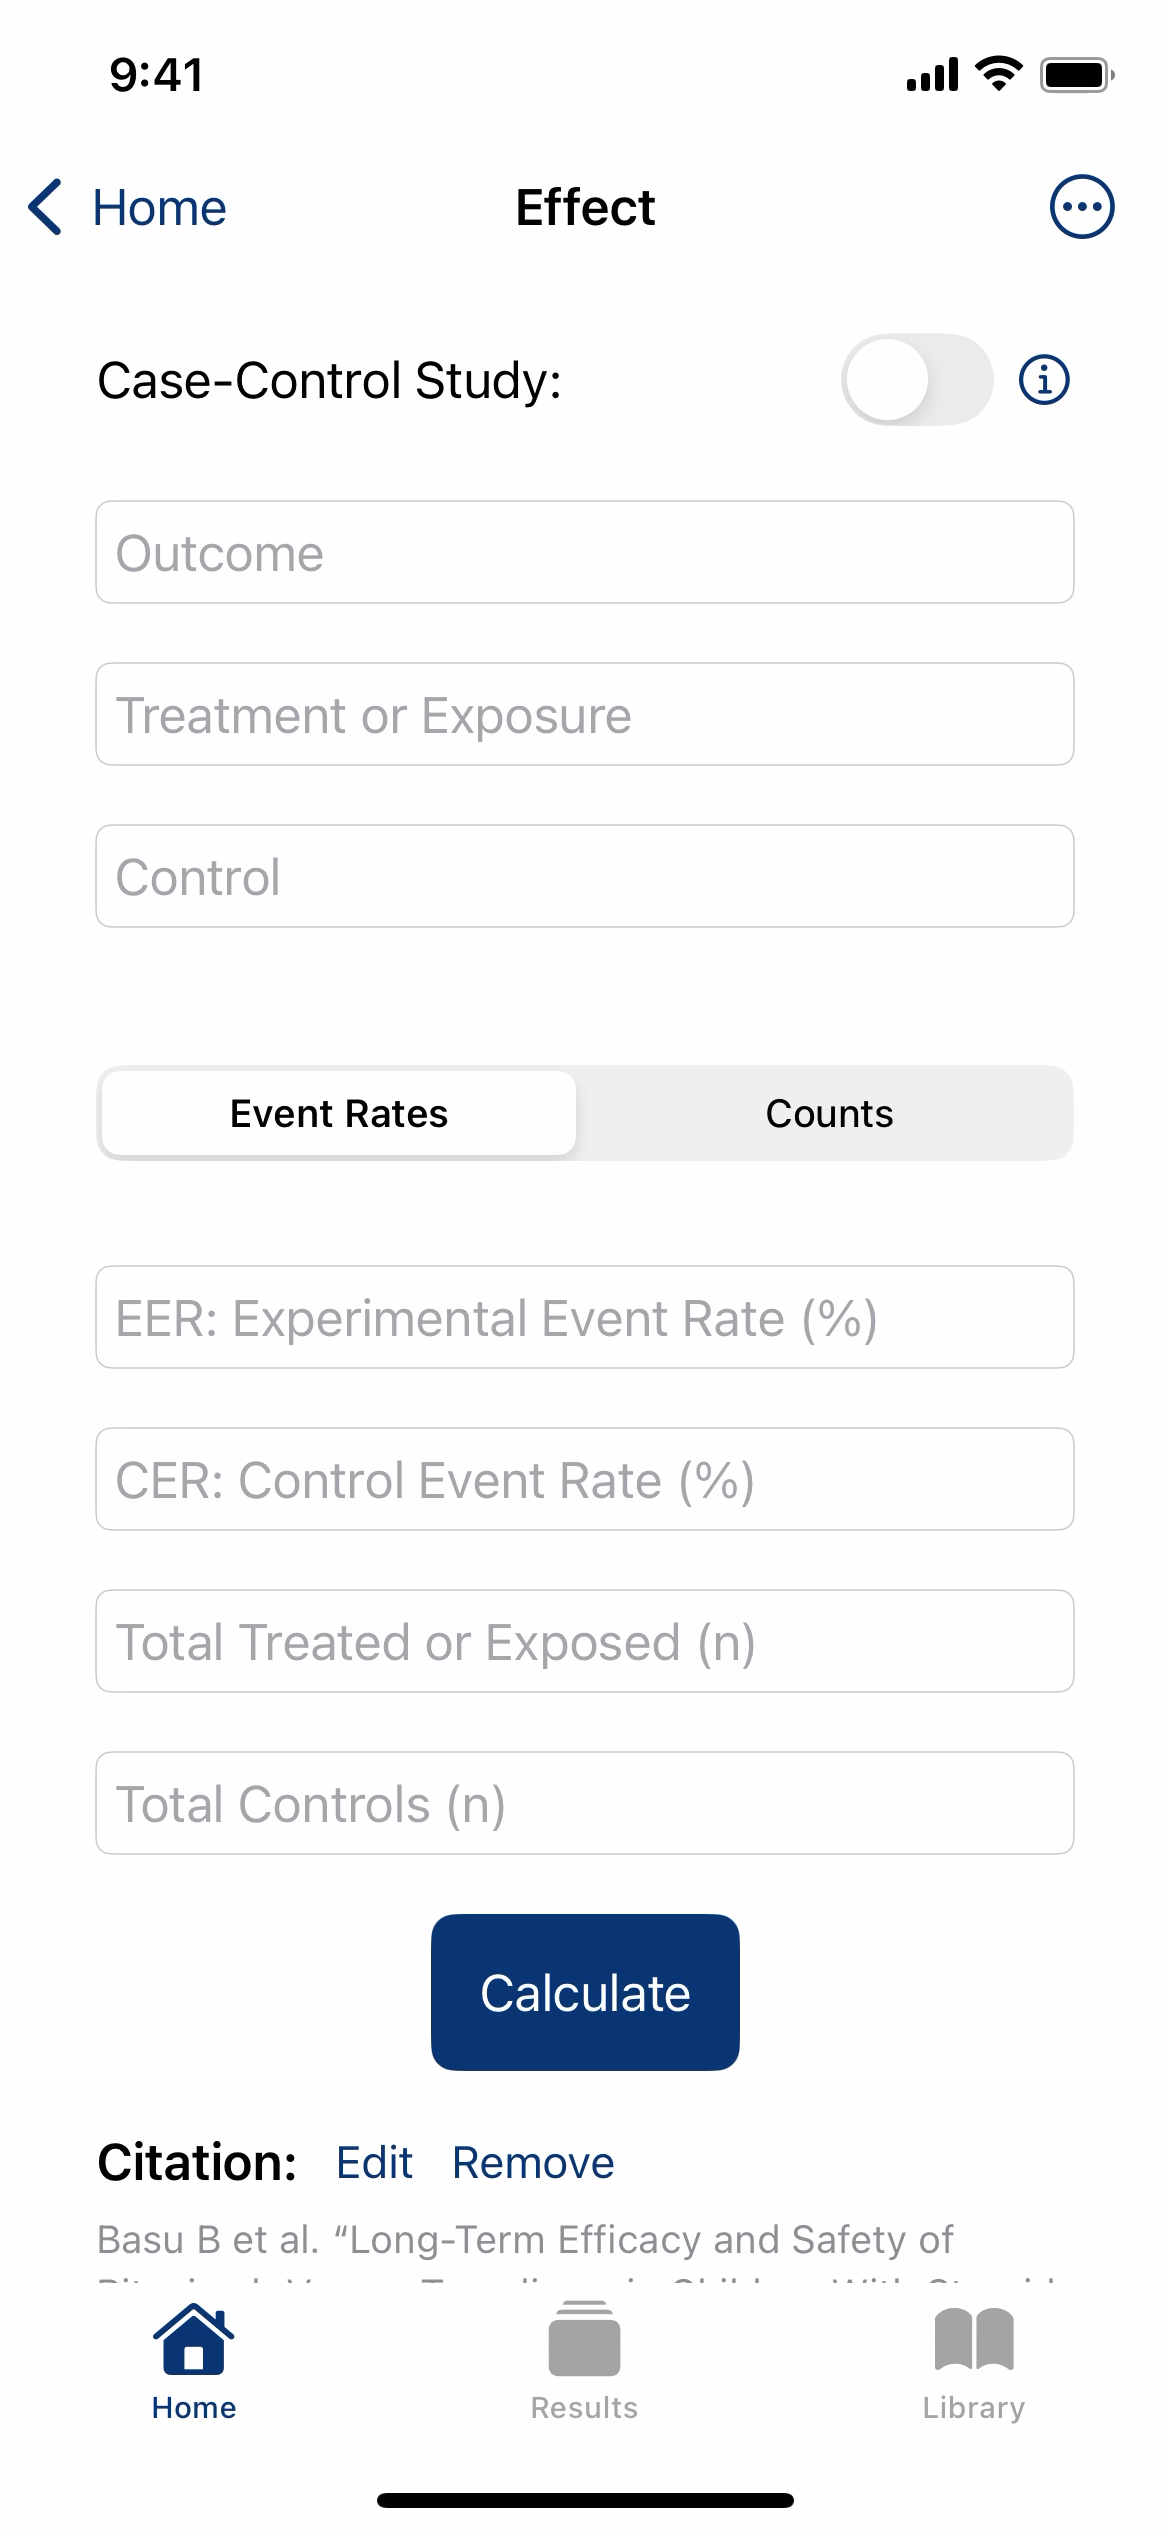
First, select how you would like to input the study data. You can choose either "Event Rates" or "Counts" (the number of participants in each arm of the study).
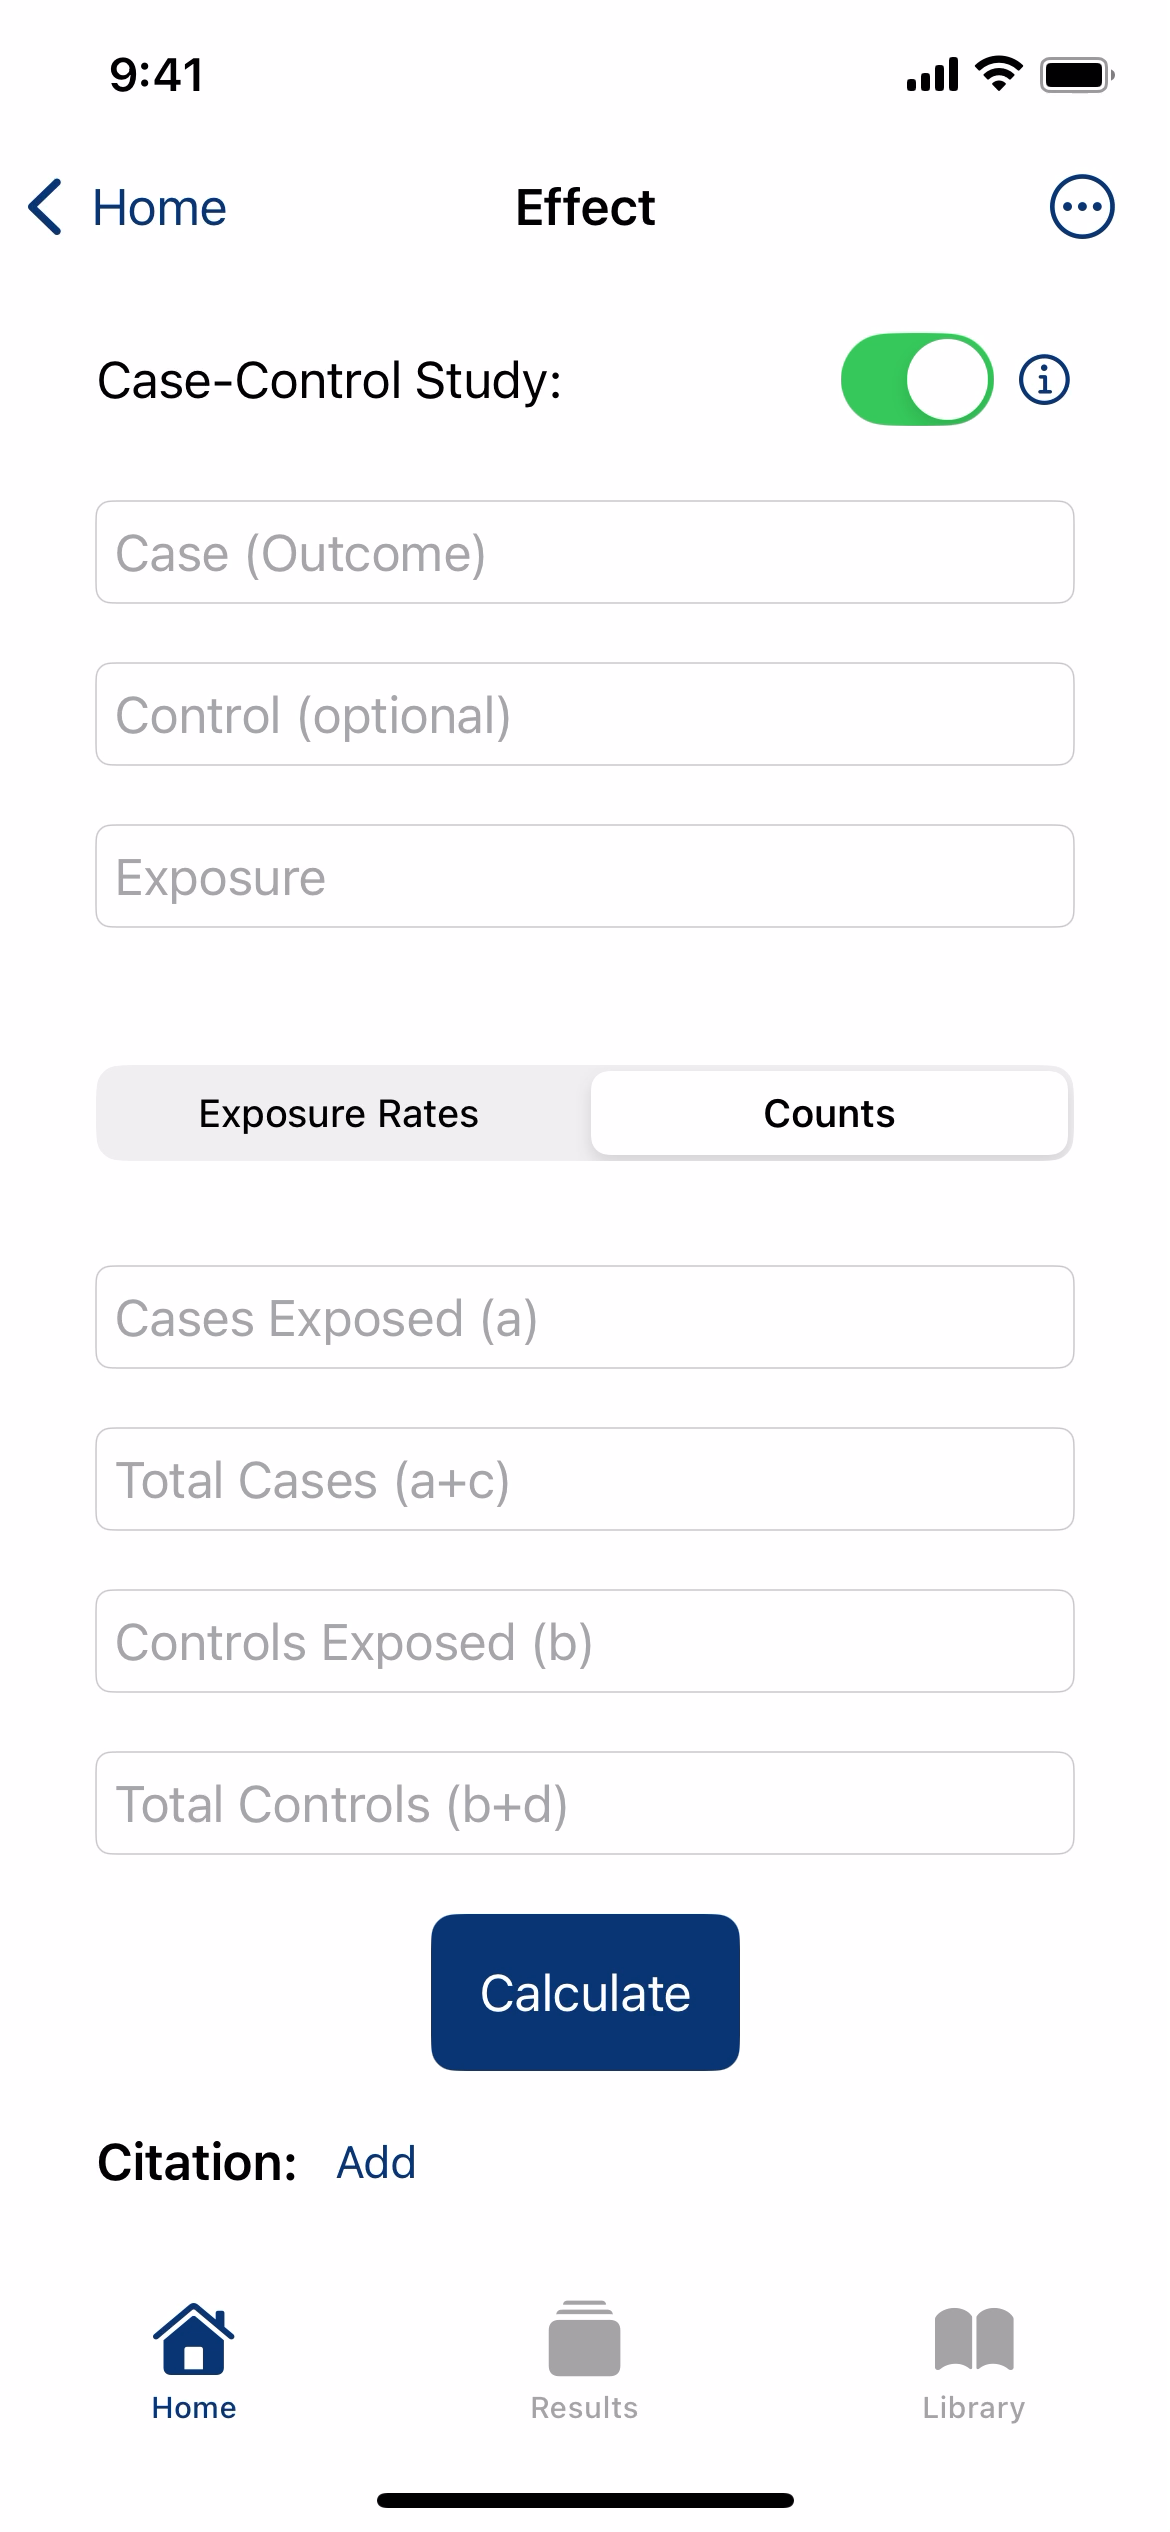
If you are reviewing a Case-Control study, enable the Case-Control Study toggle. This changes the input fields to match the way data are collected in these studies—starting with groups of cases (with the outcome) and controls (without the outcome), then entering exposure information for each group.
Exposure Rates for Case-Control Study:

or Counts for Case-Control Study:
Based on how the authors of this randomized controlled trial[1] presented their results in the table below, you could choose either "Event Rates" or "Counts" to input the data.
Here, I chose to enter the event rates (EER 90.0%, CER 63.3%):
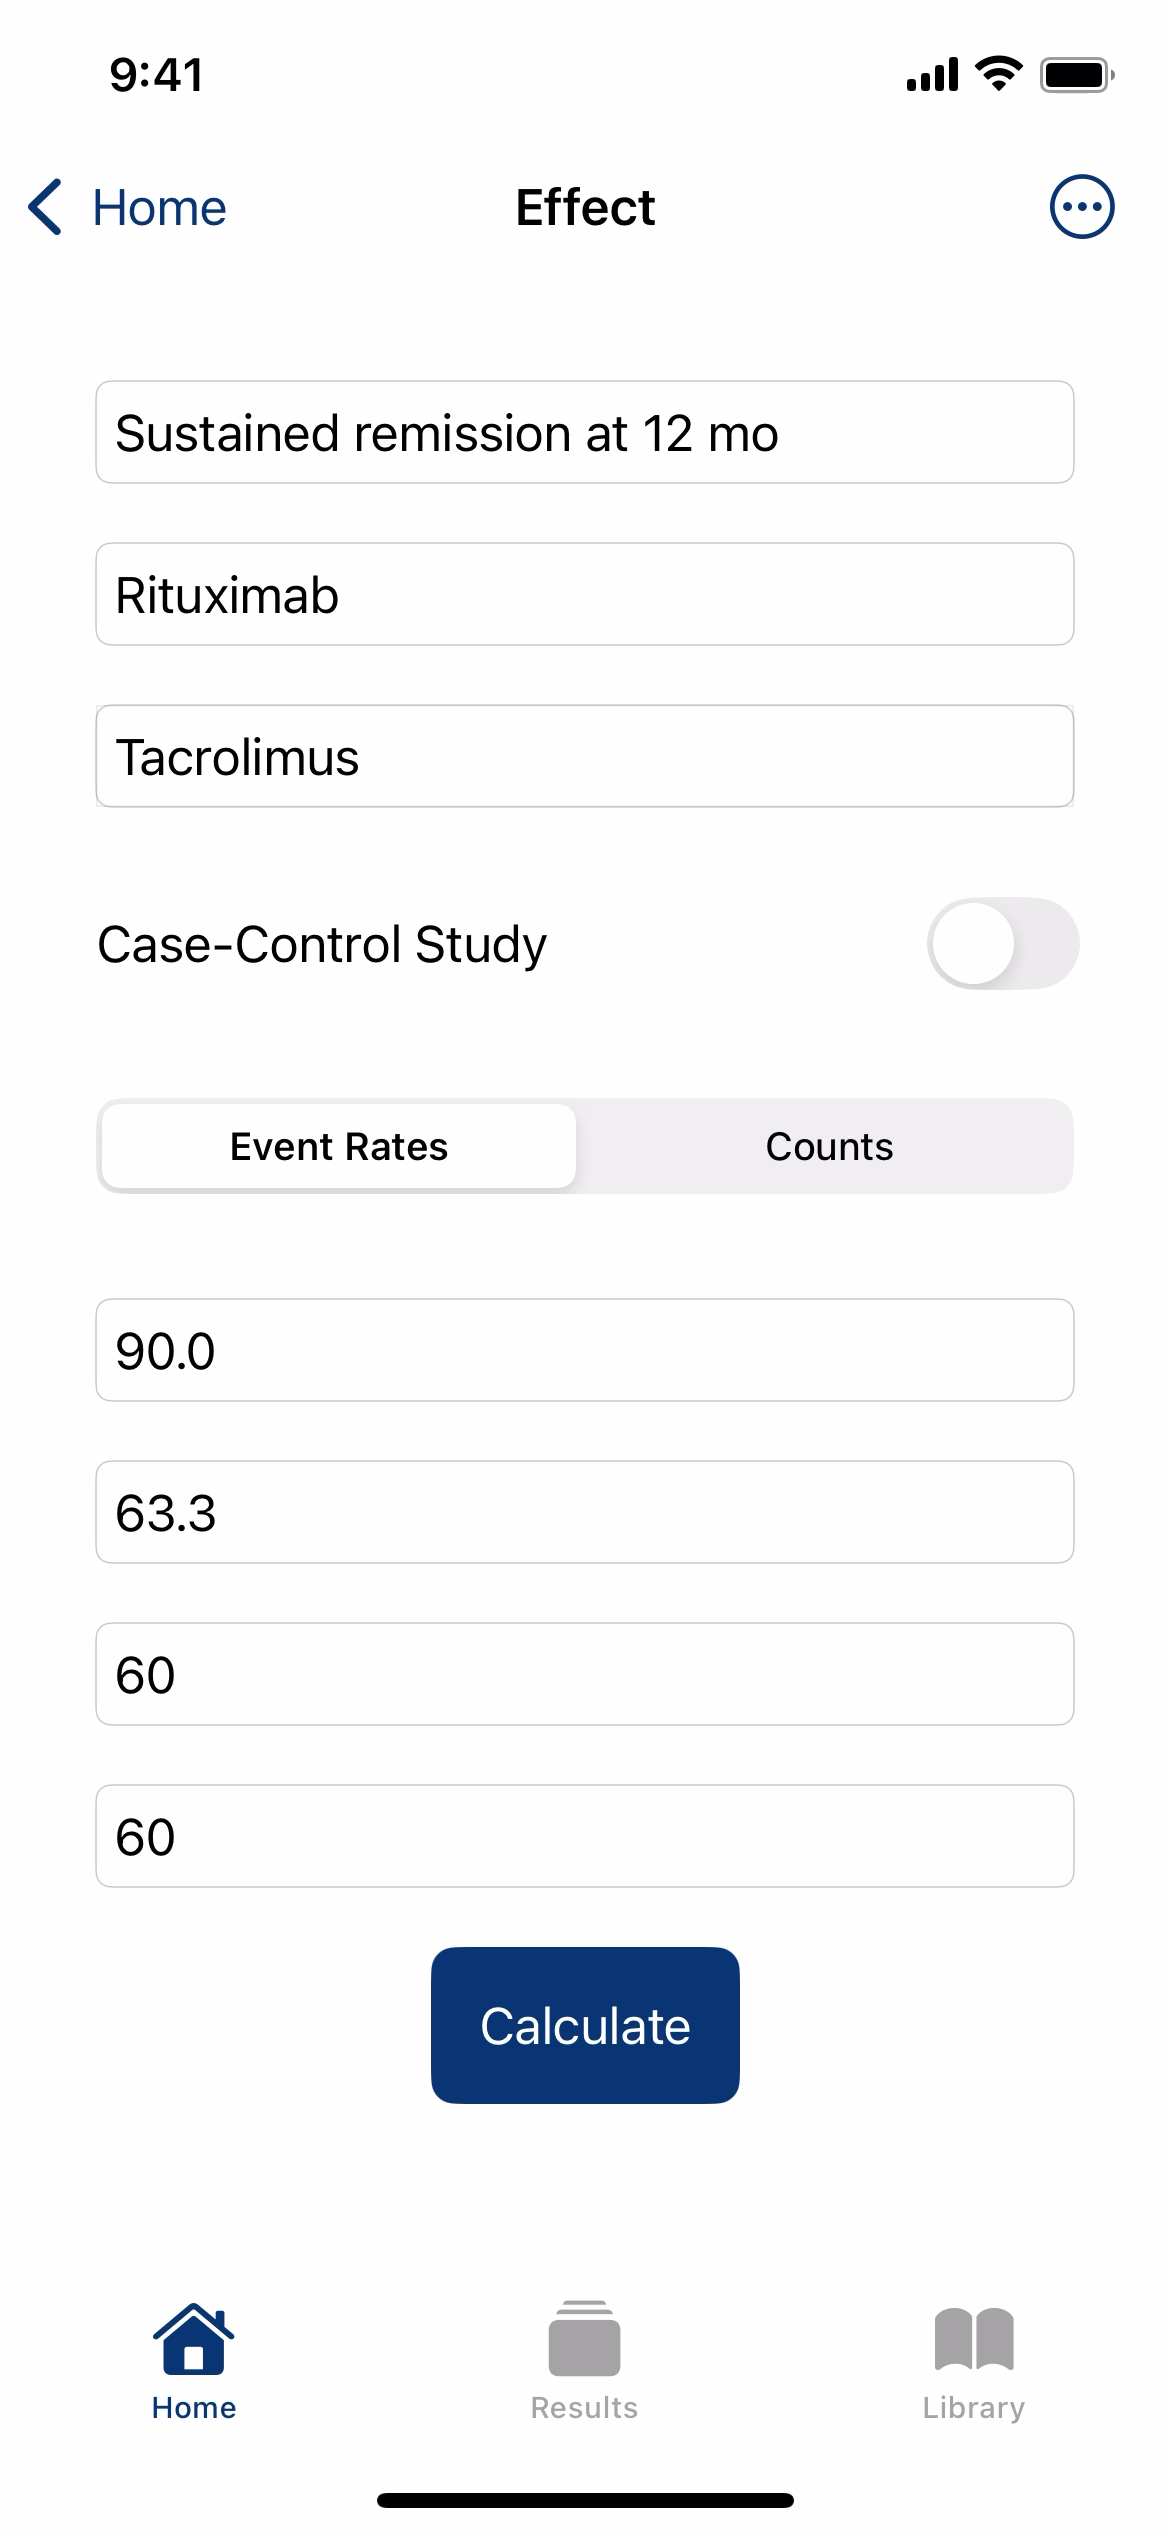
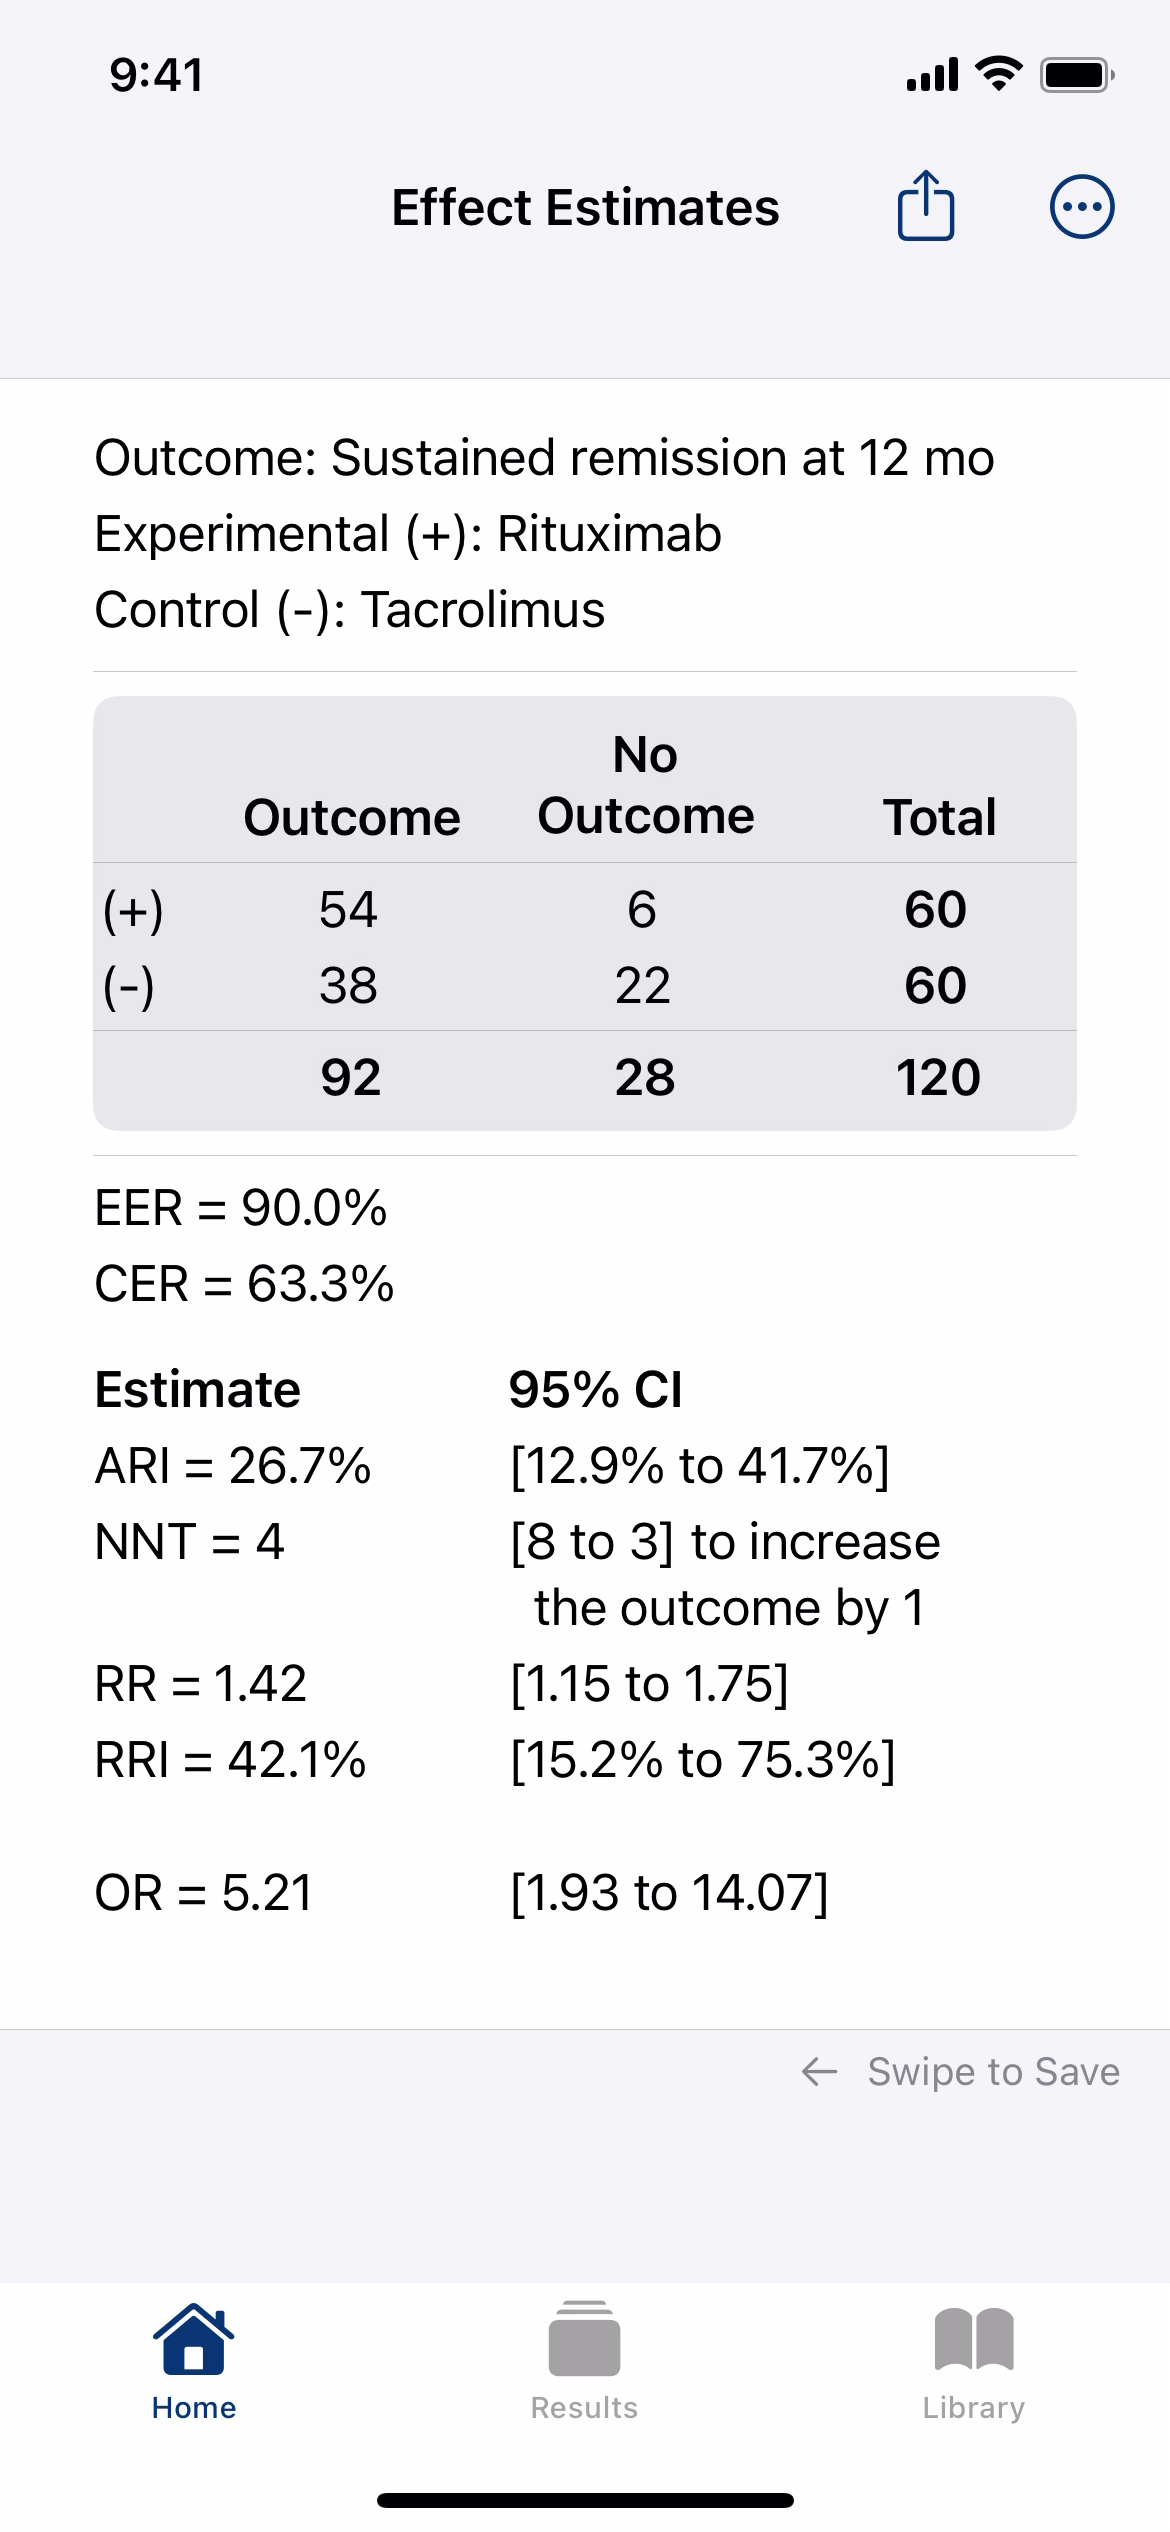
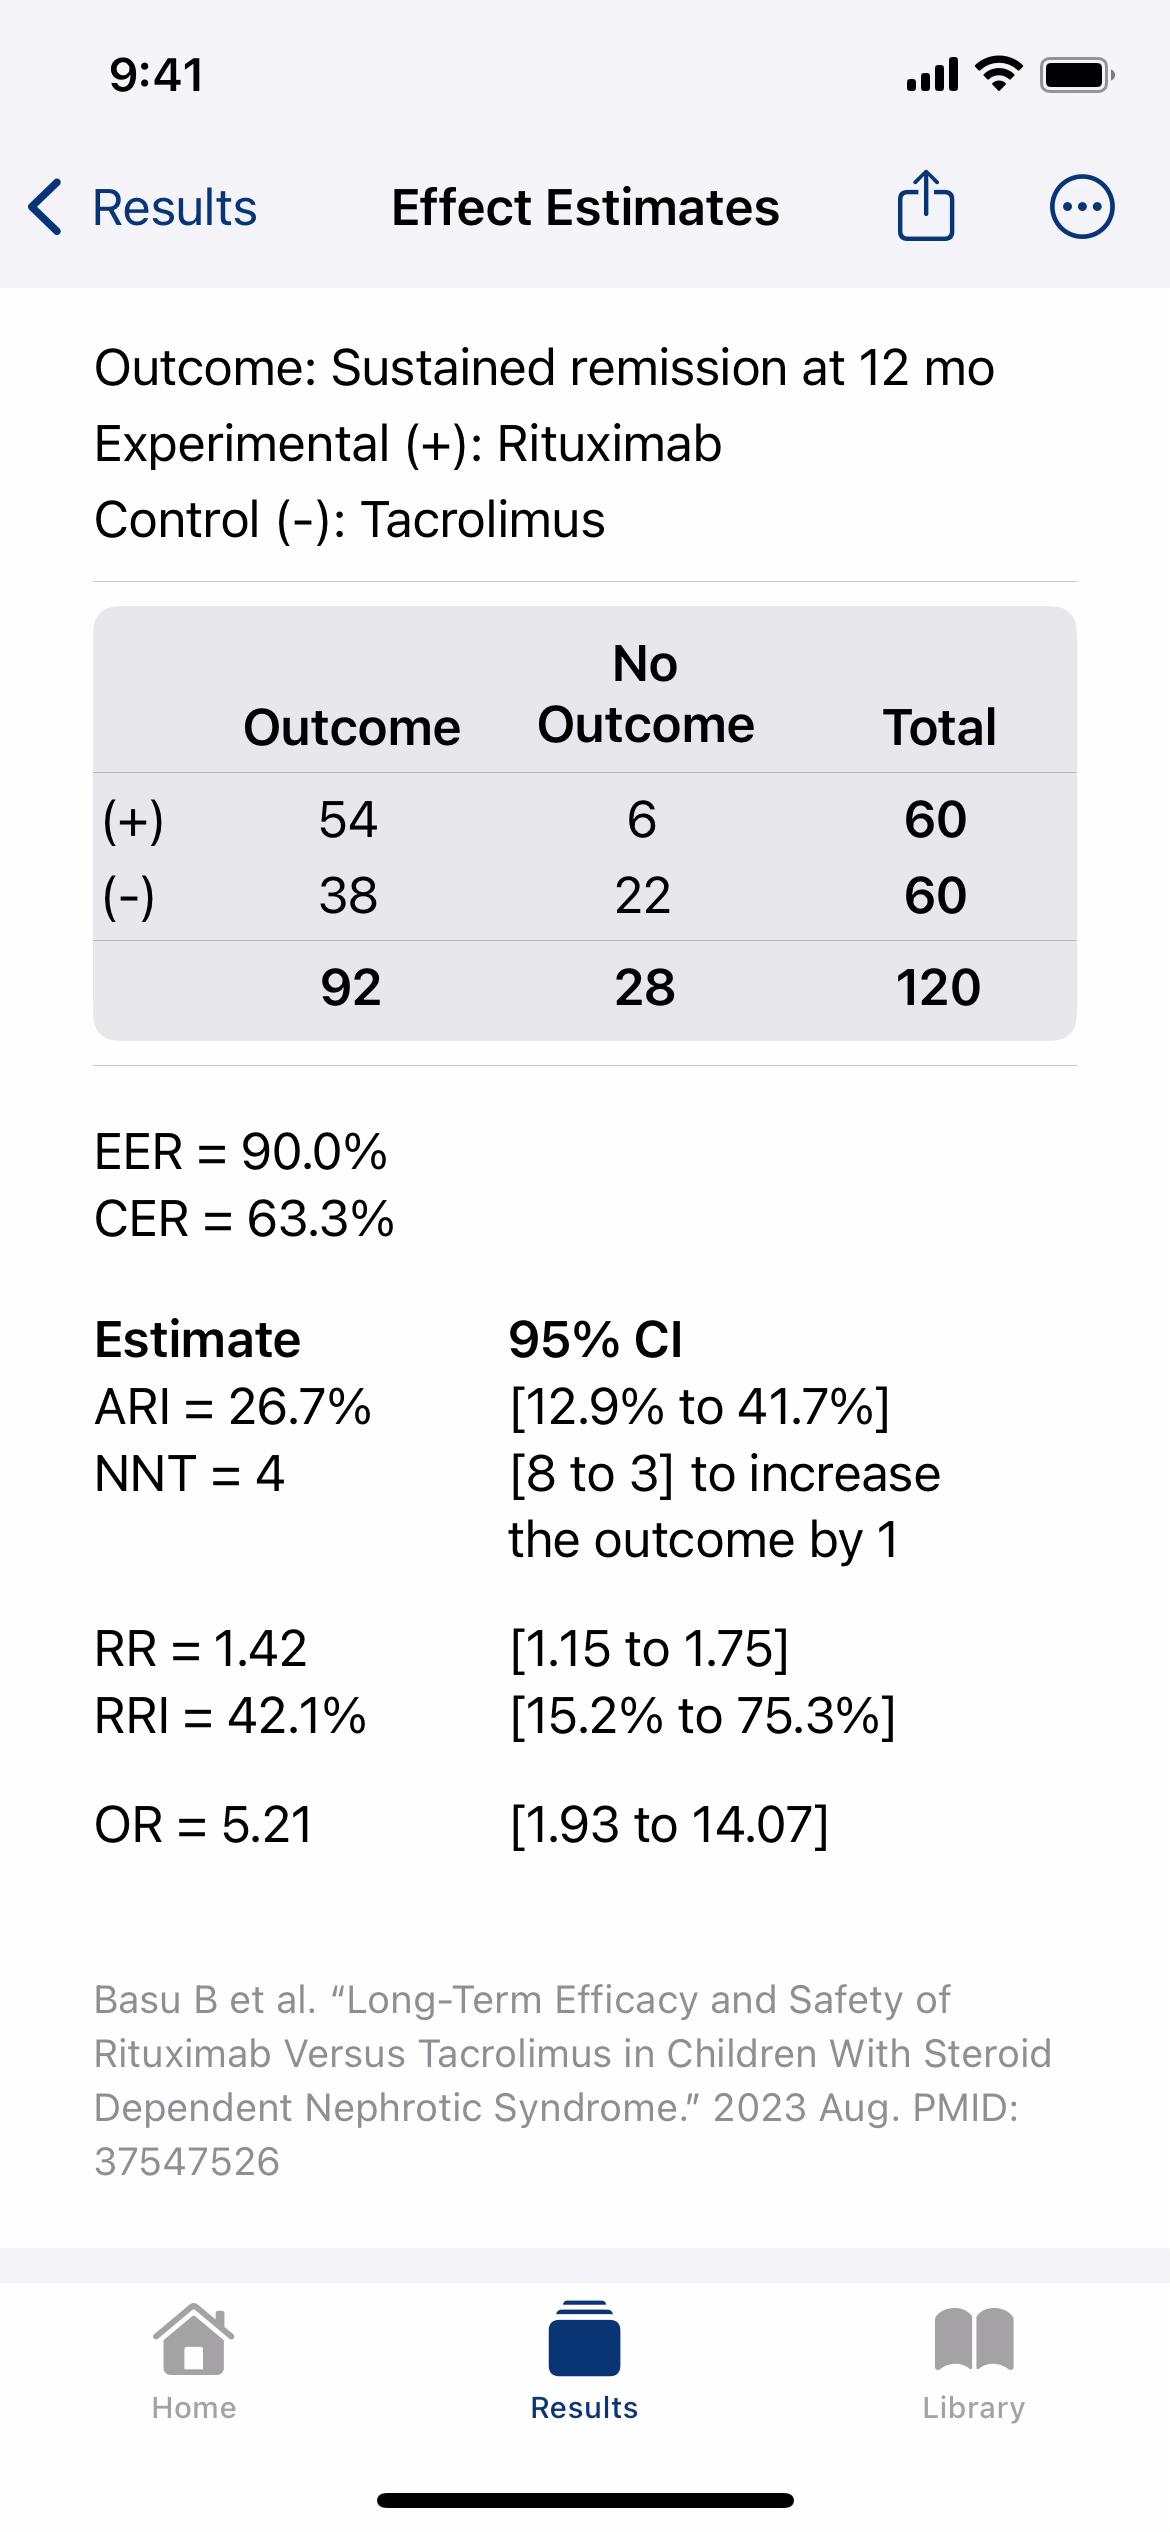
Press the "Calculate" button to see the relevant effect estimates and their confidence intervals.
The manuscript's table above provides the odds ratio (OR), but absolute risk measures offer a clearer understanding of the treatment effect’s magnitude. In this example, EBM Calculator displays the absolute risk increase (ARI) and number needed to treat (NNT) to cause one additional outcome, along with relative risk metrics and their confidence intervals.
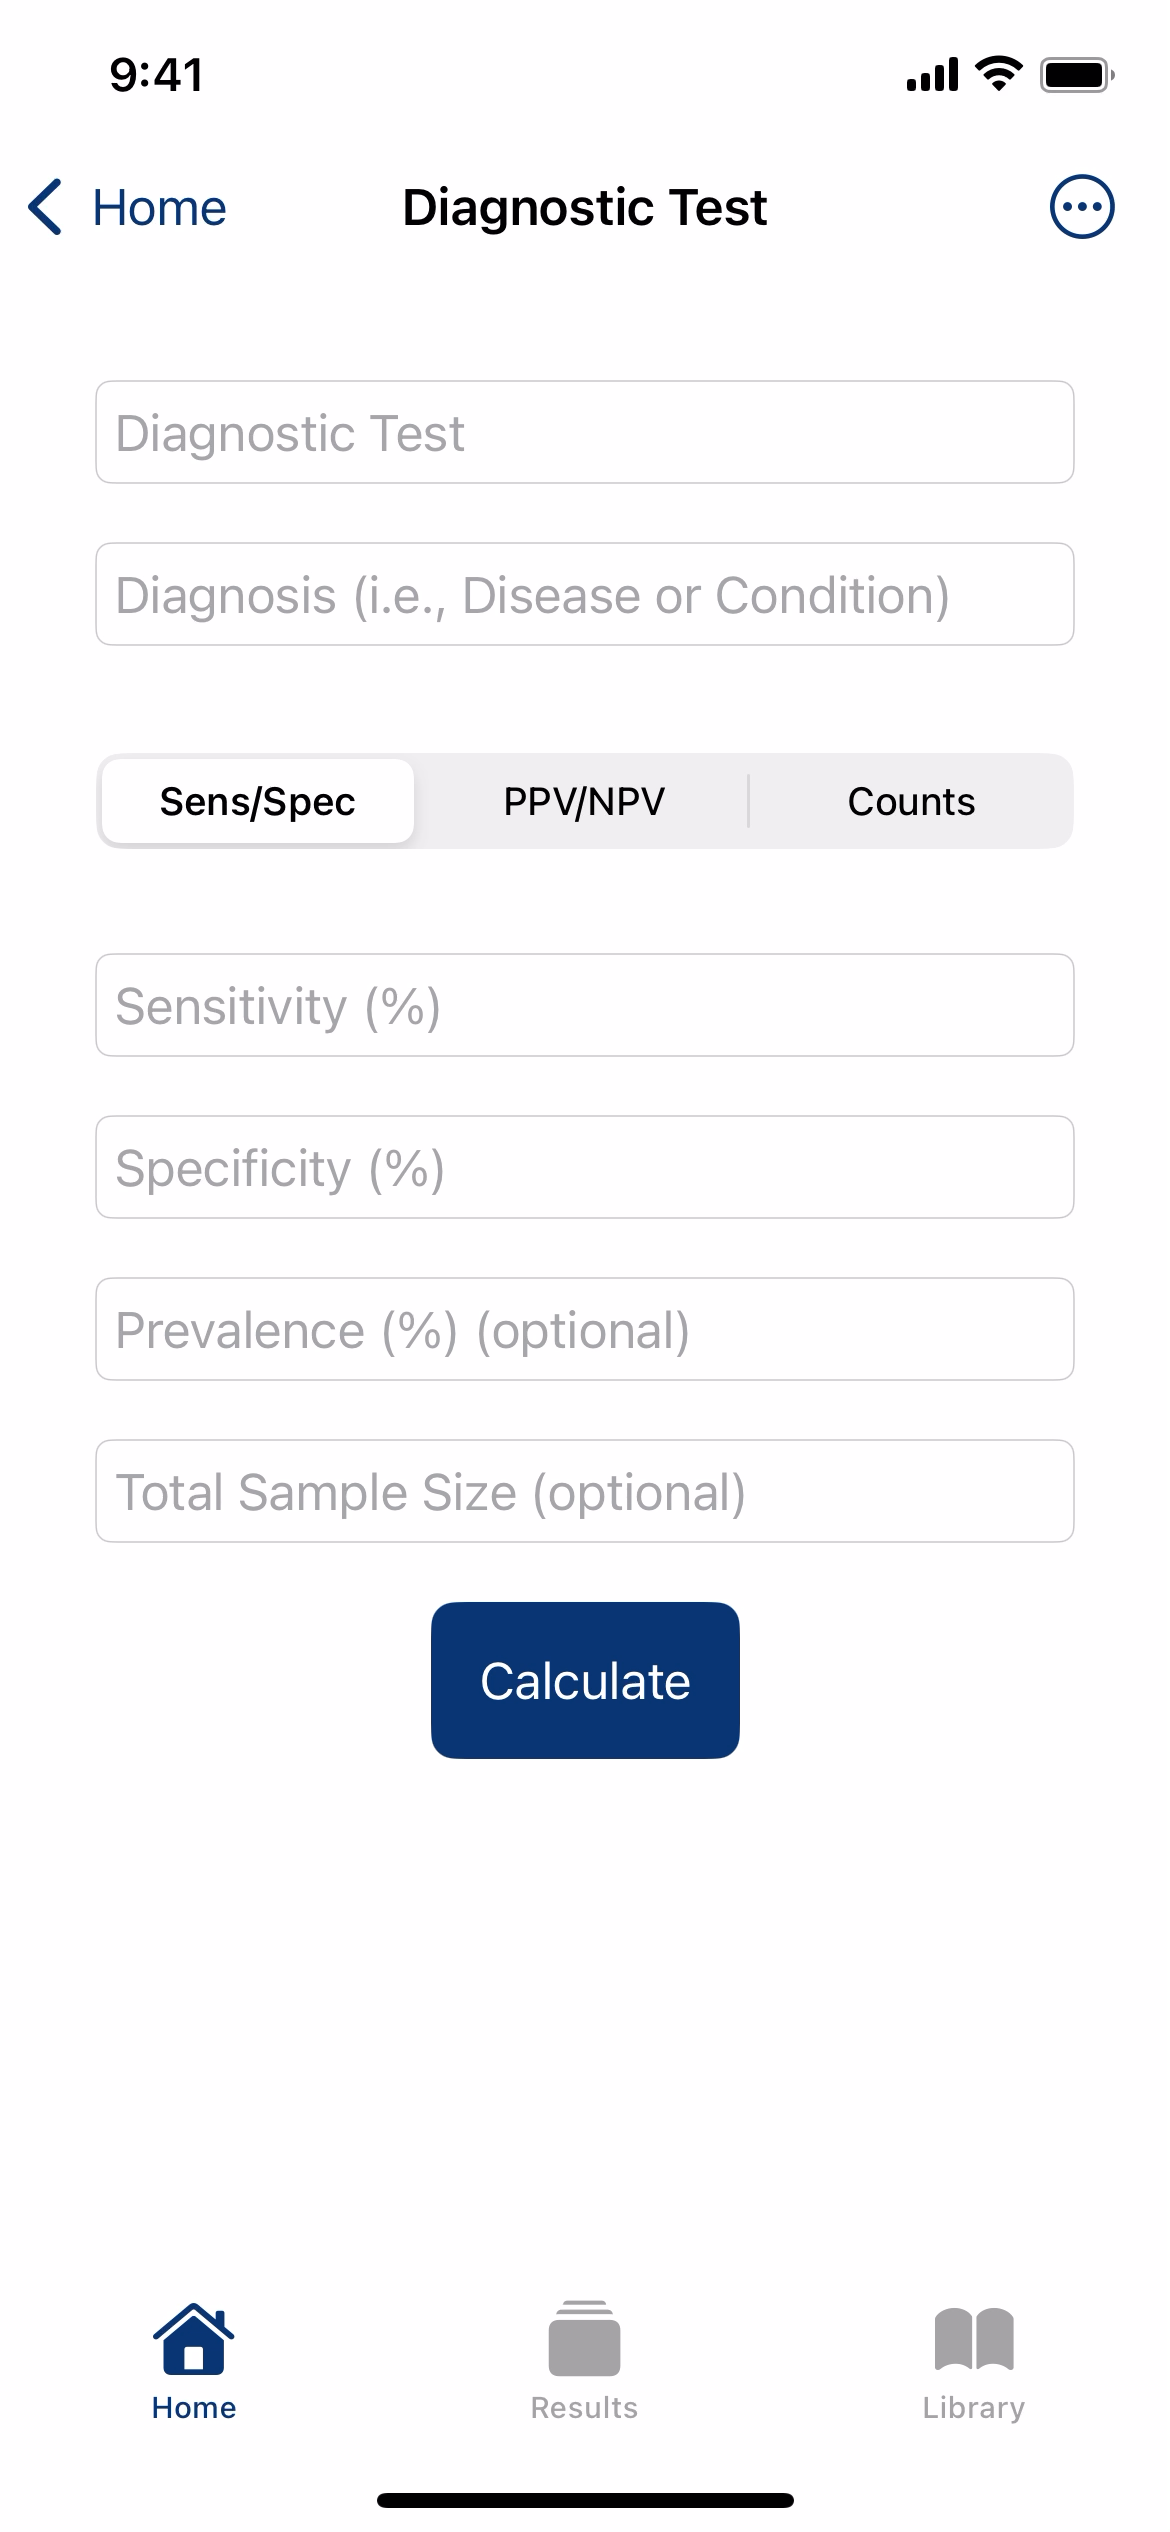
First, select how you would like to input the study data. You can choose from "Sens/Spec" (sensitivity and specificity), "PPV/NPV" (positive and negative predictive values), or "Counts" (the number of participants in each arm of the study).
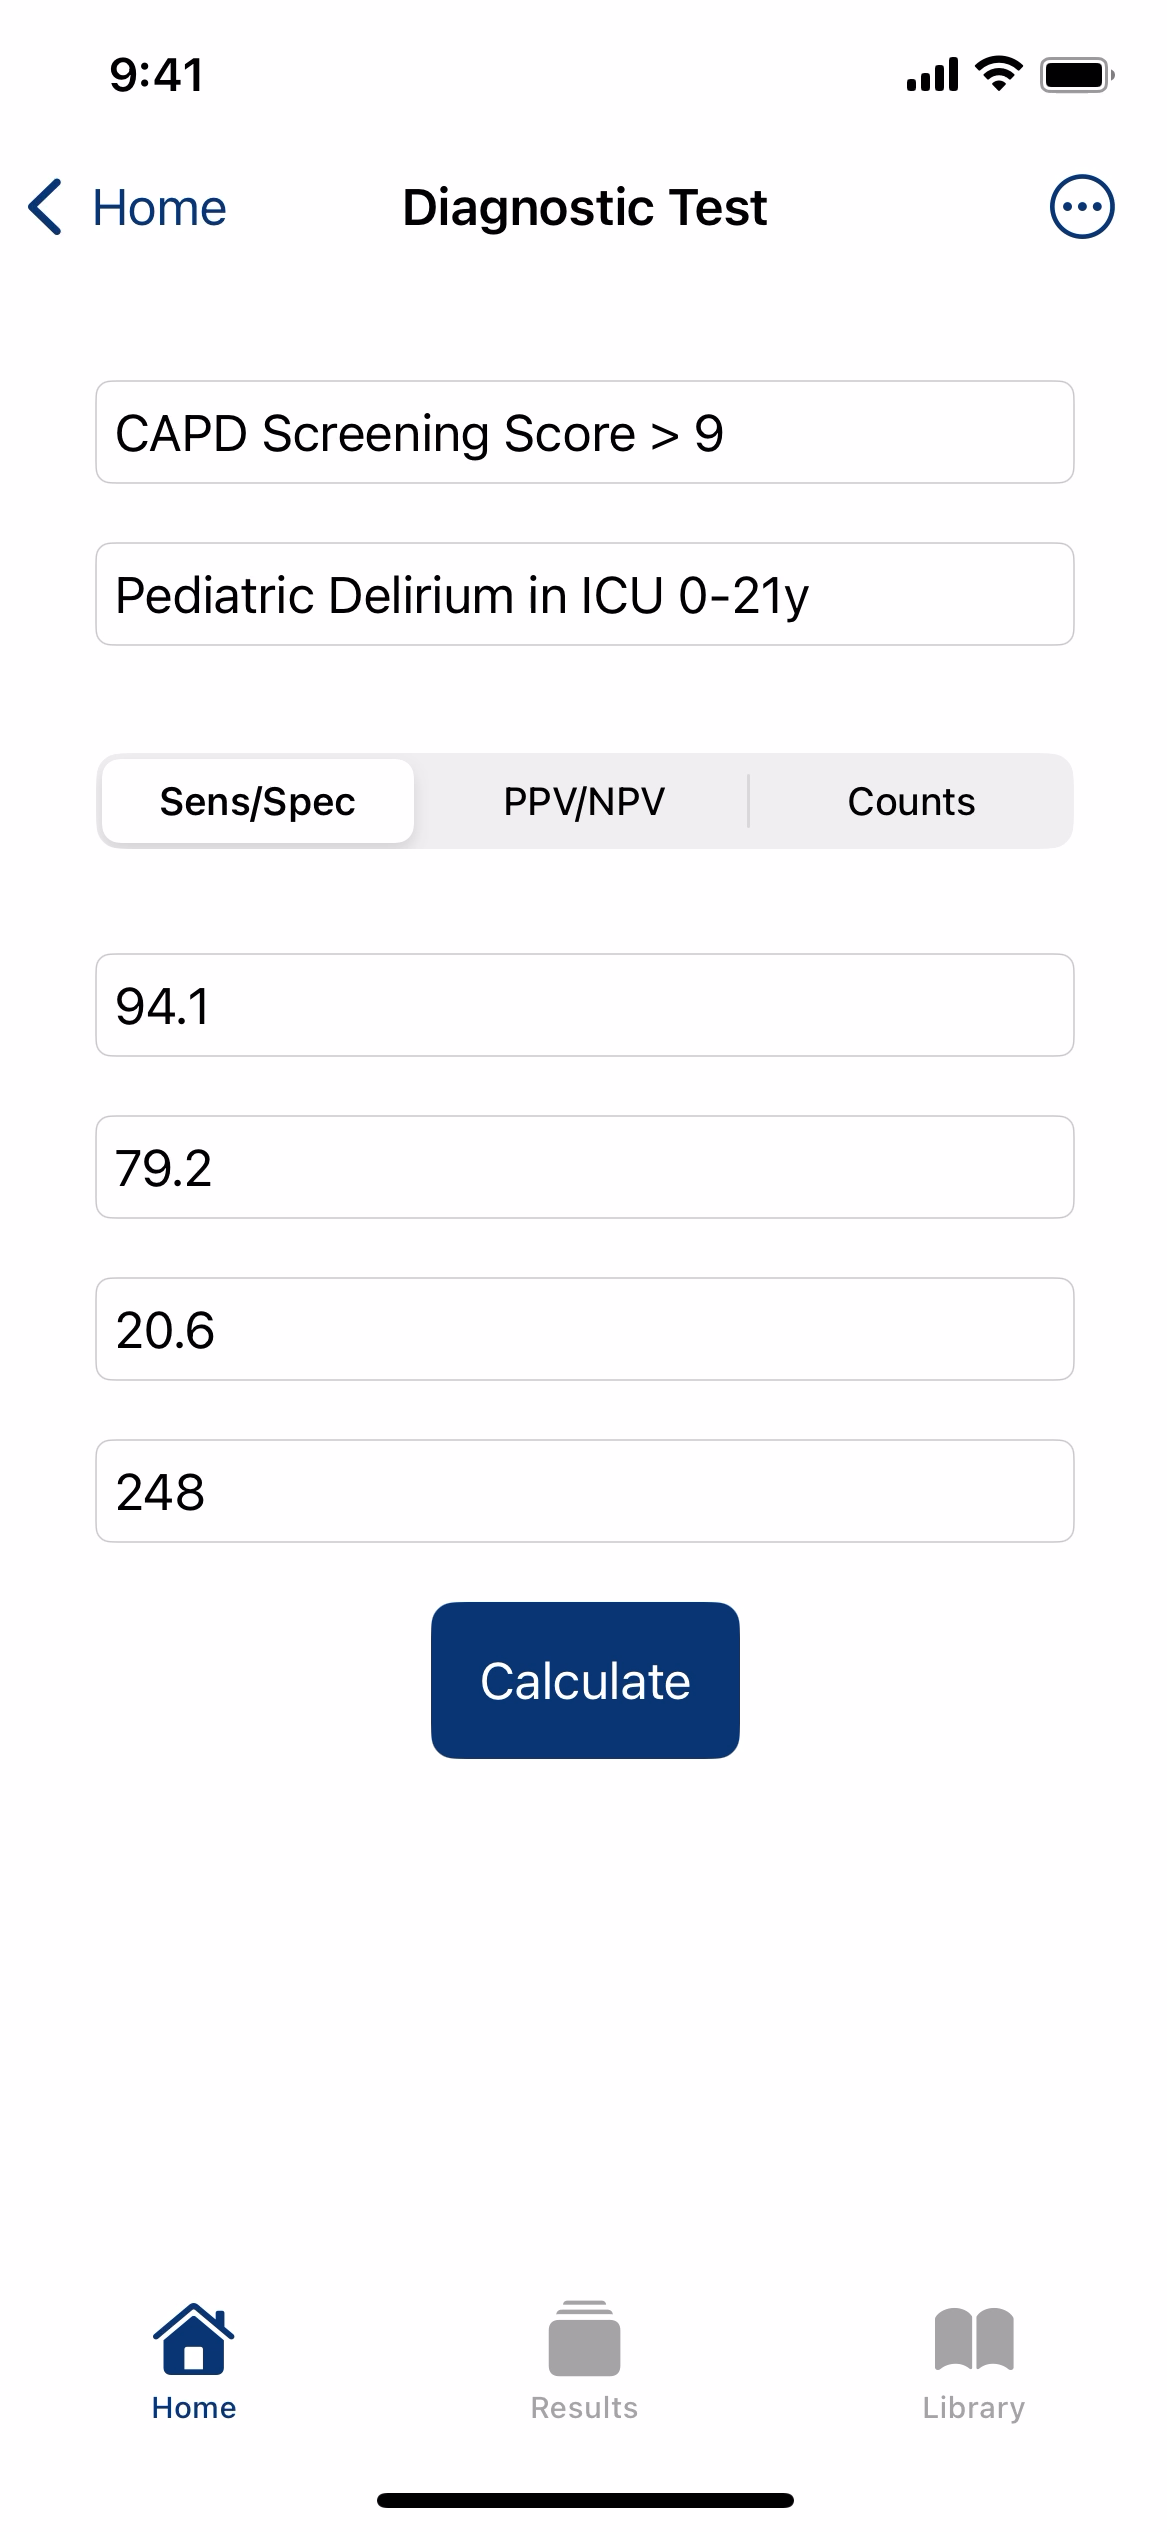
Based on how the authors of this study[2] presented their results in the table below, it would be easiest to use the "Sens/Spec" input method.
Enter the sensitivity (94.1%), specificity (79.2%), prevalence (20.6%), and total sample size (248).
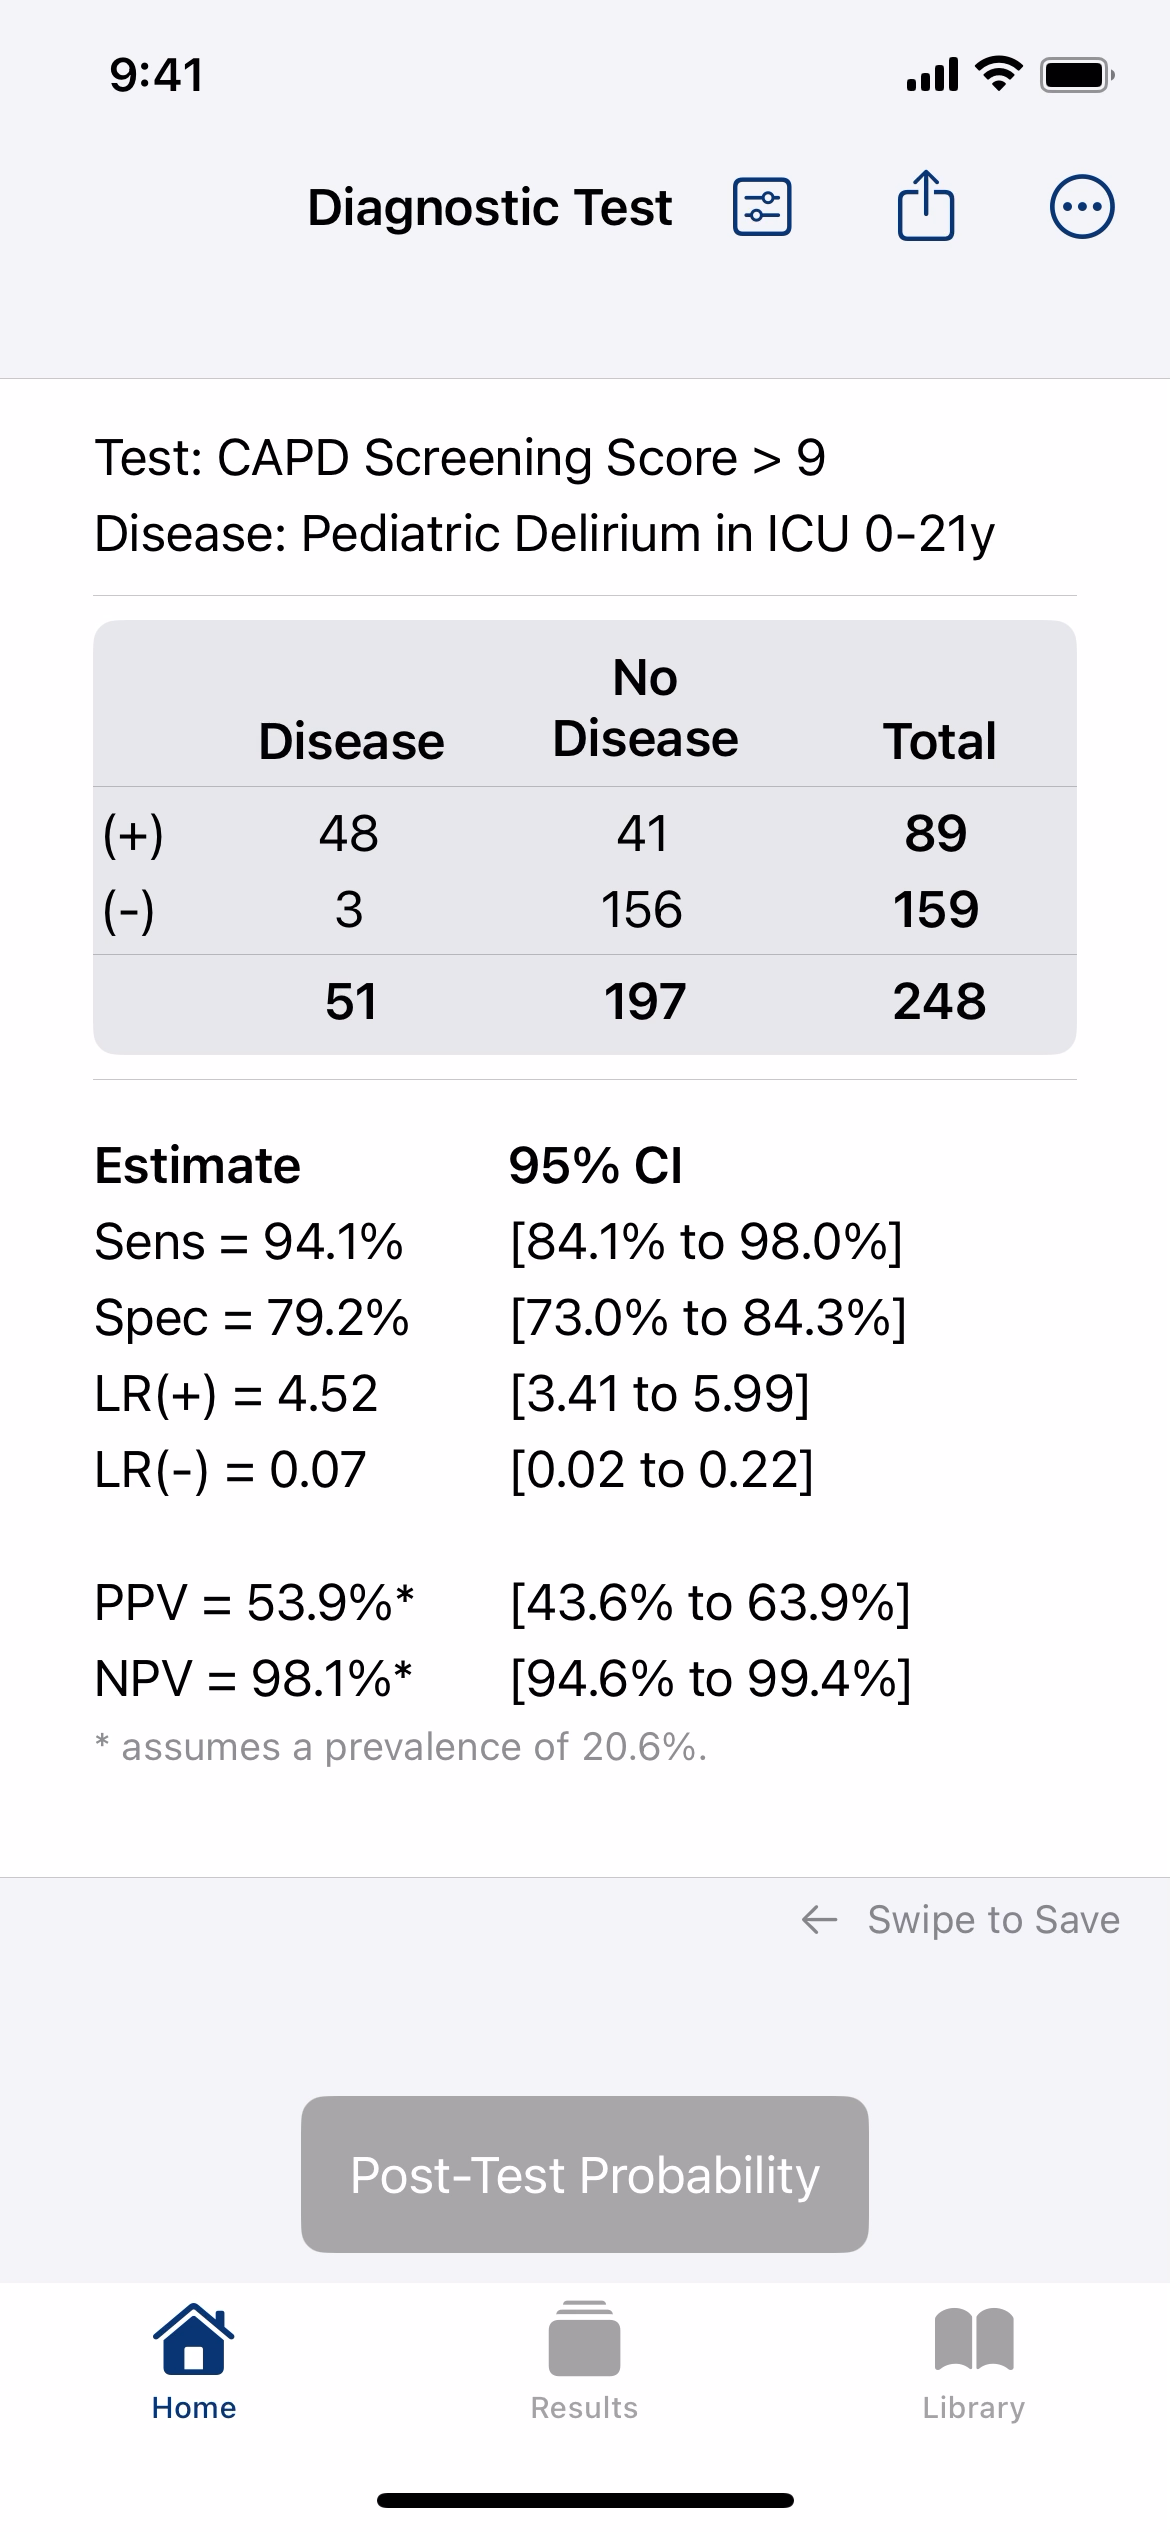
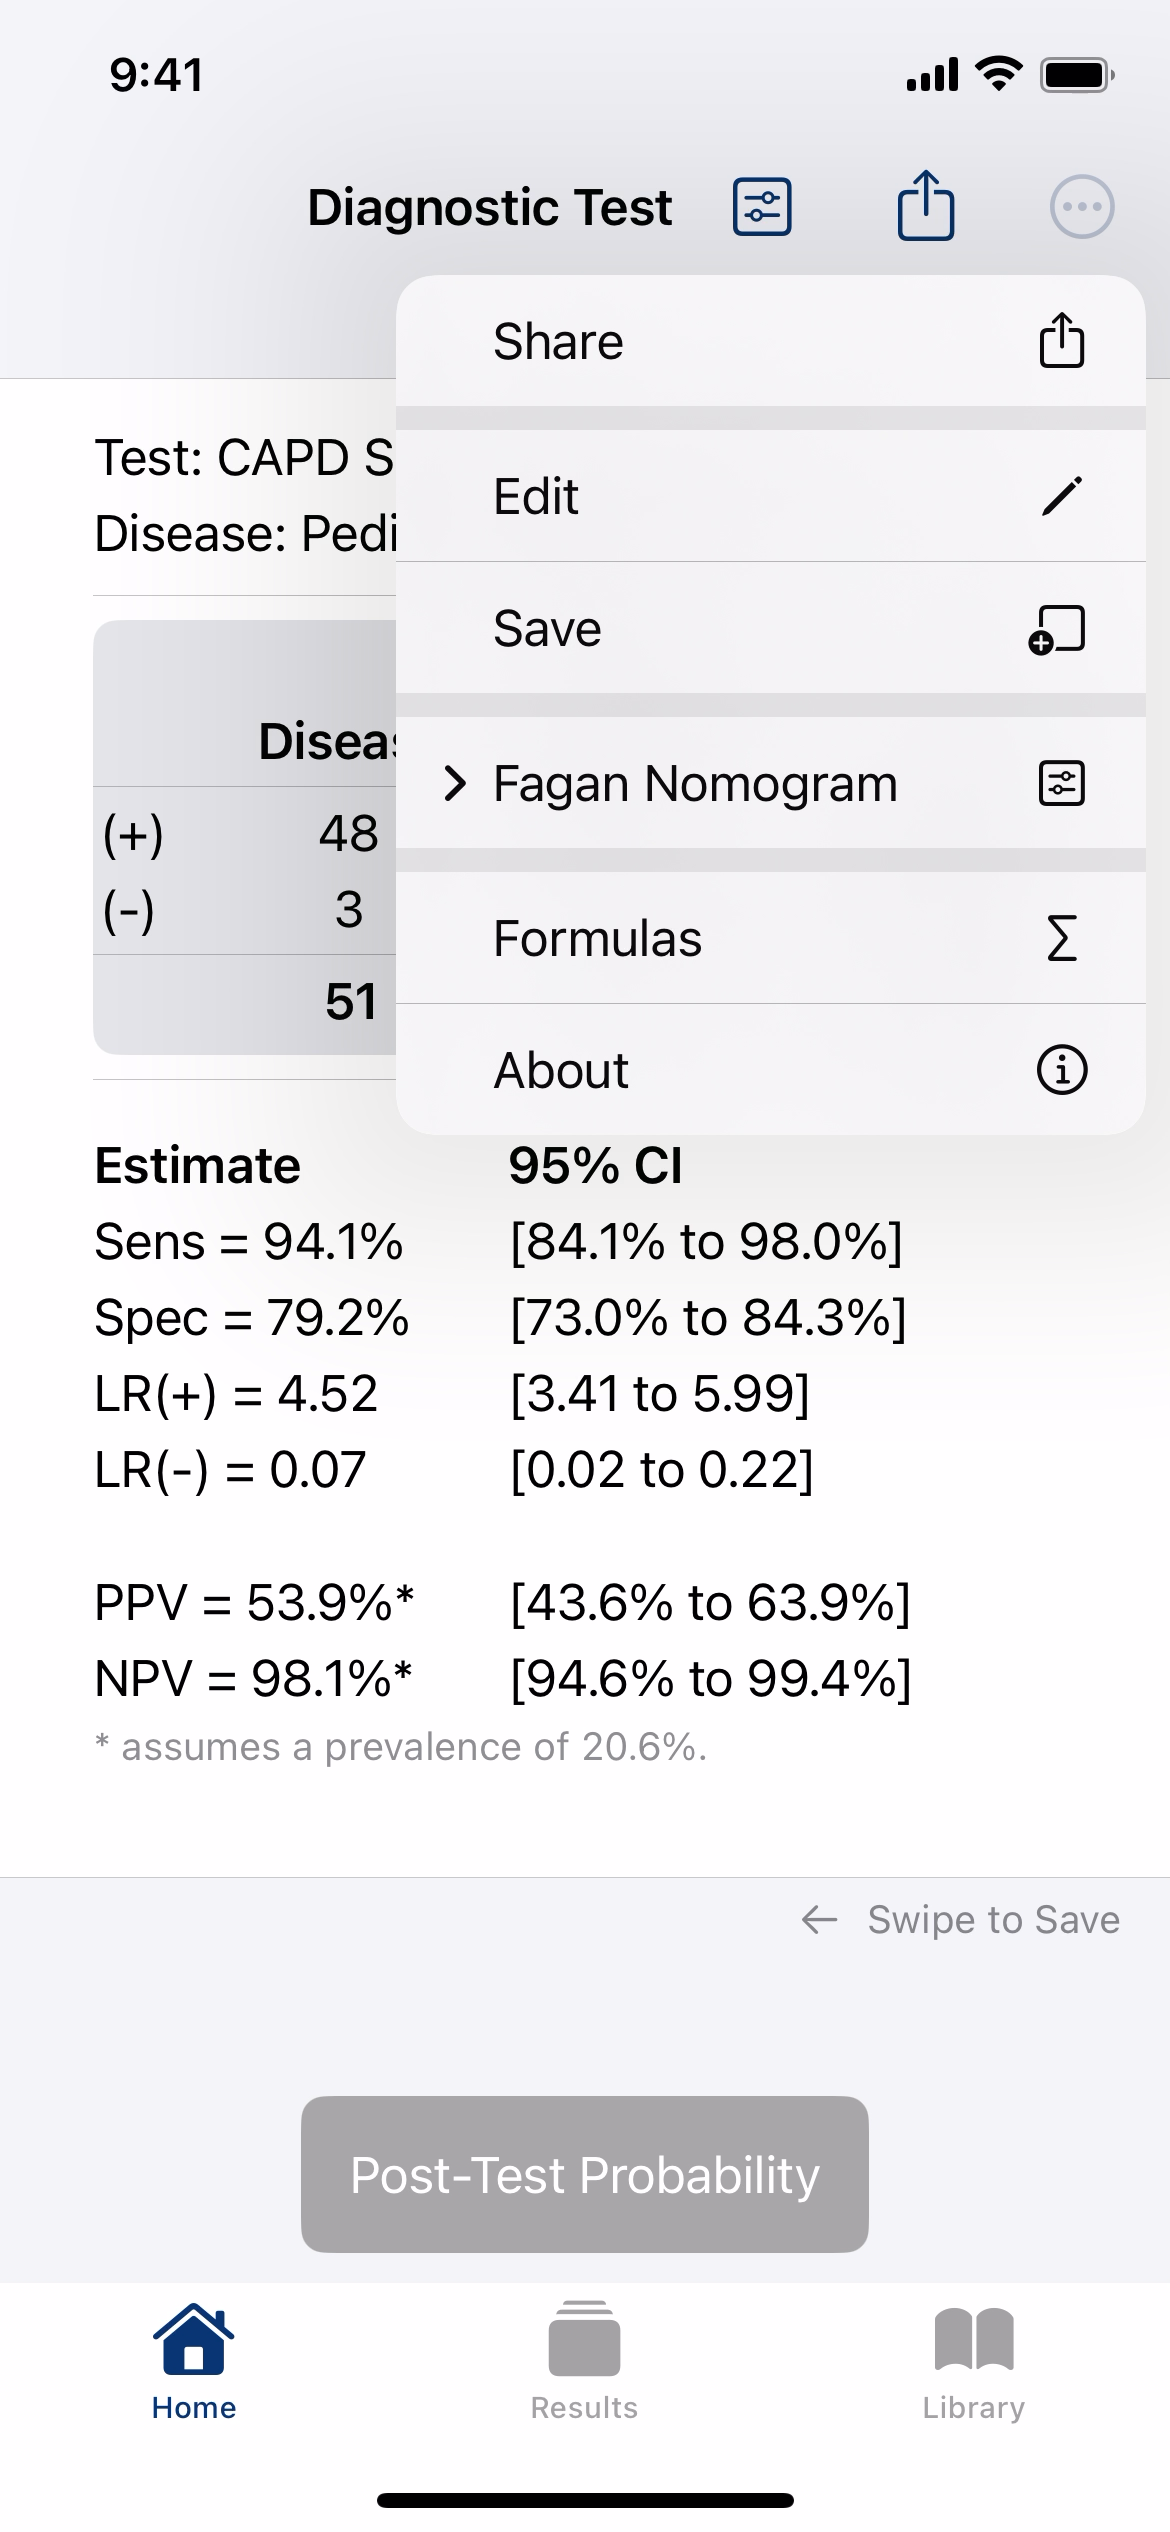
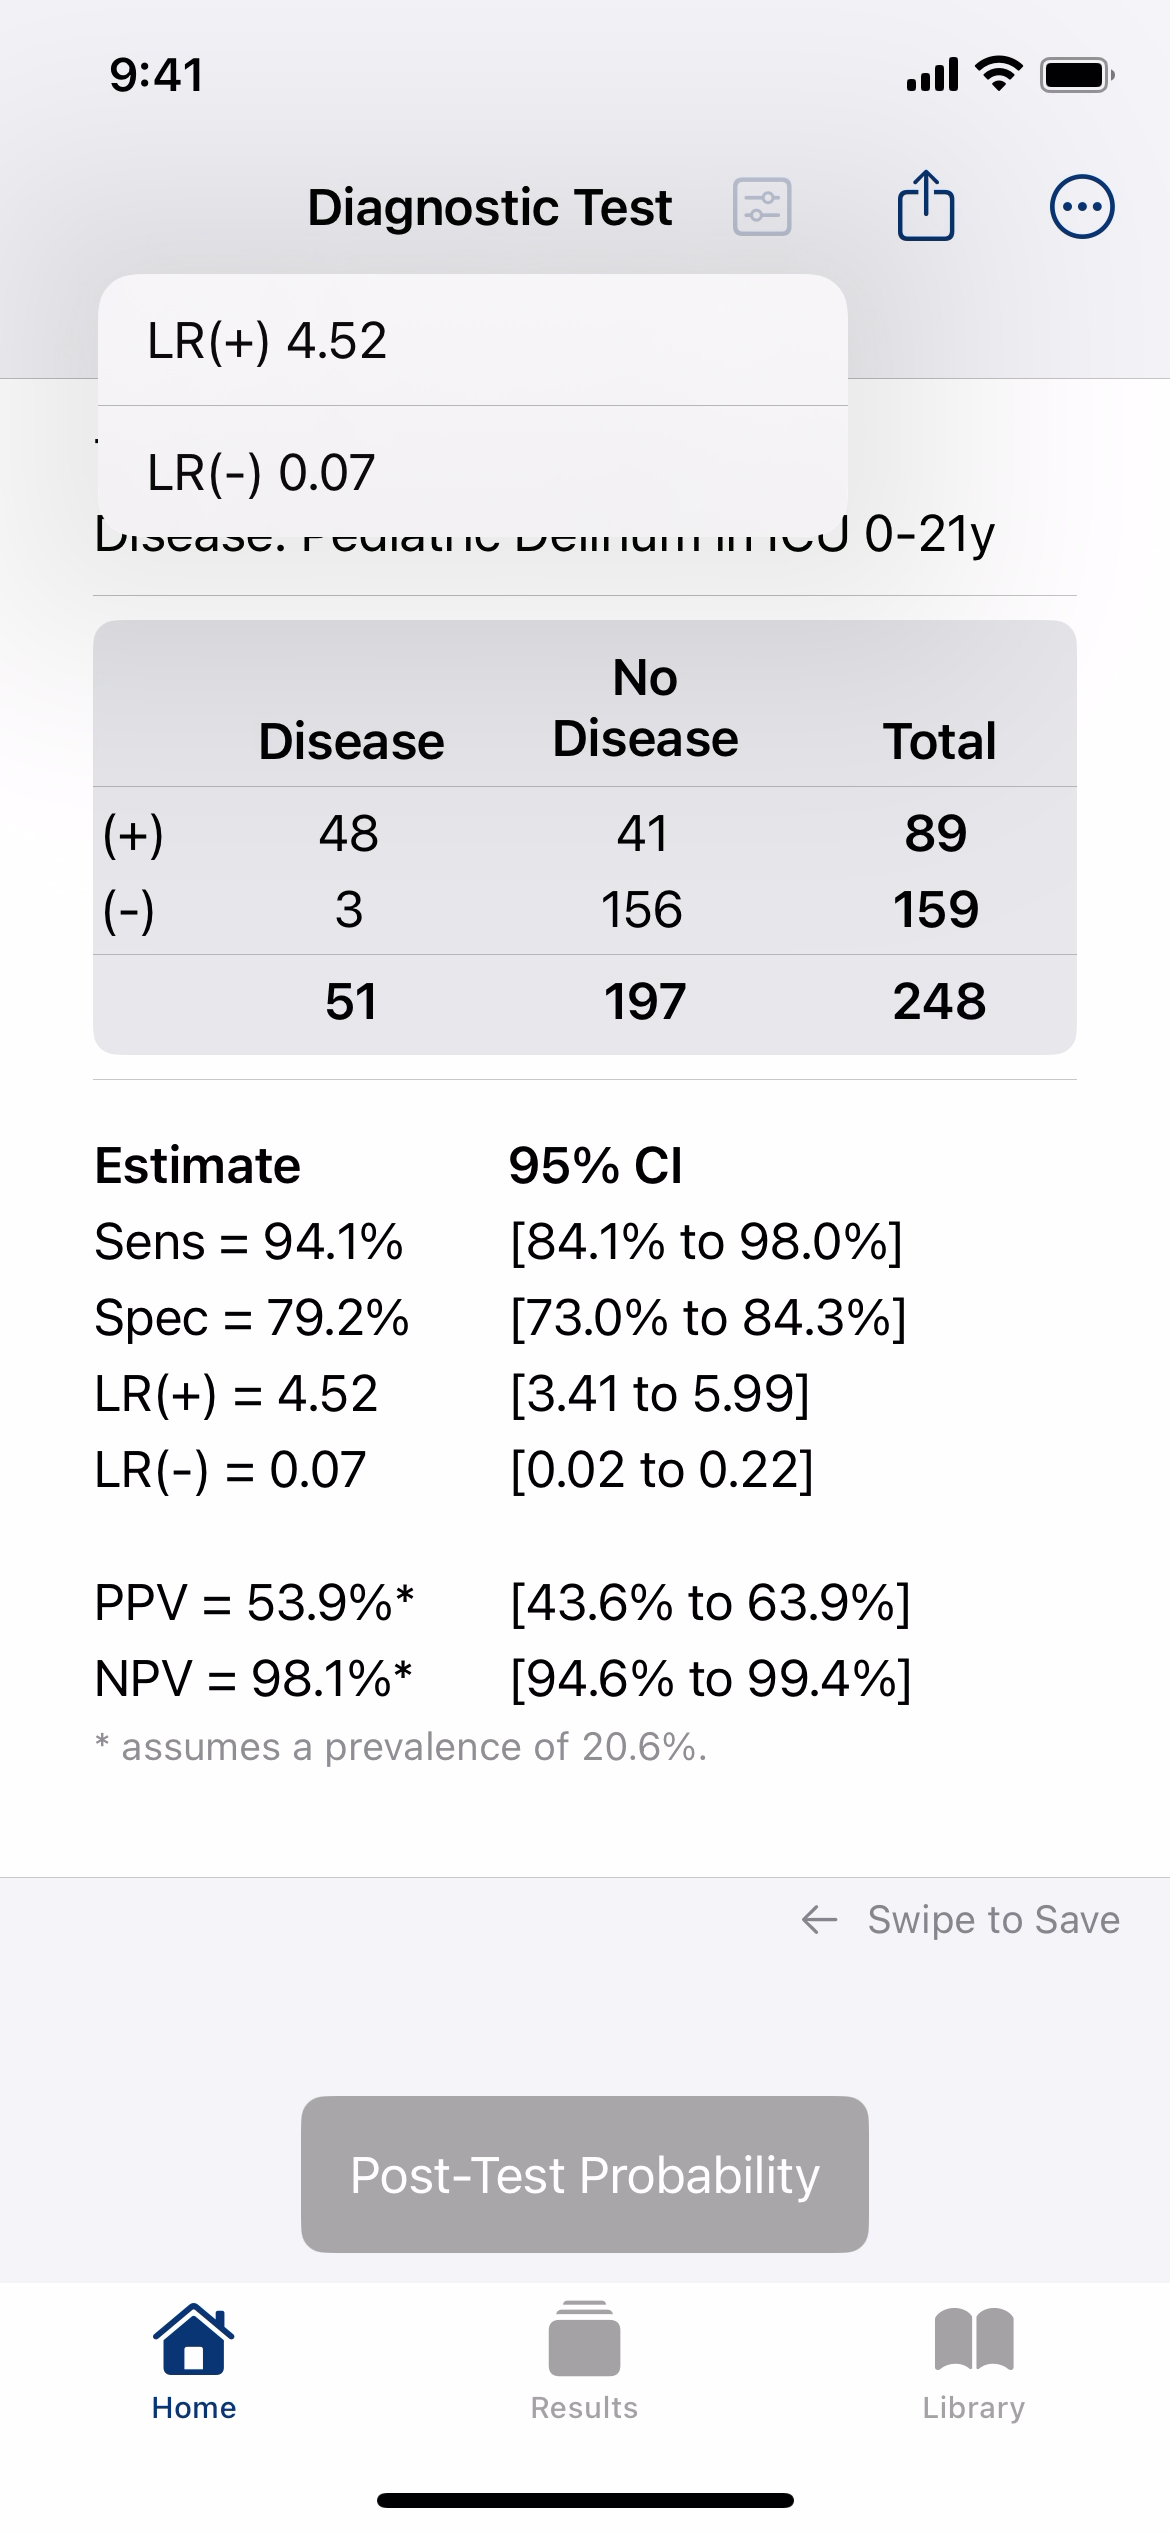
Press the "Calculate" button to see the relevant diagnostic test metrics and their confidence intervals.
The manuscript's table above provides sensitivity and specificity. Some authors also report positive and negative predictive values (PPV and NPV). However, because predictive values depend on disease prevalence, they may not apply to your patients if the study population's prevalence differs from your own.
For this reason, we prefer using positive and negative likelihood ratios (LRs) to better understand post-test probability. In this example, EBM Calculator displays LR(+) and LR(–) with confidence intervals, along with an option to calculate post-test probability using a different prevalence.
Press the menu button at the top right to see more options.
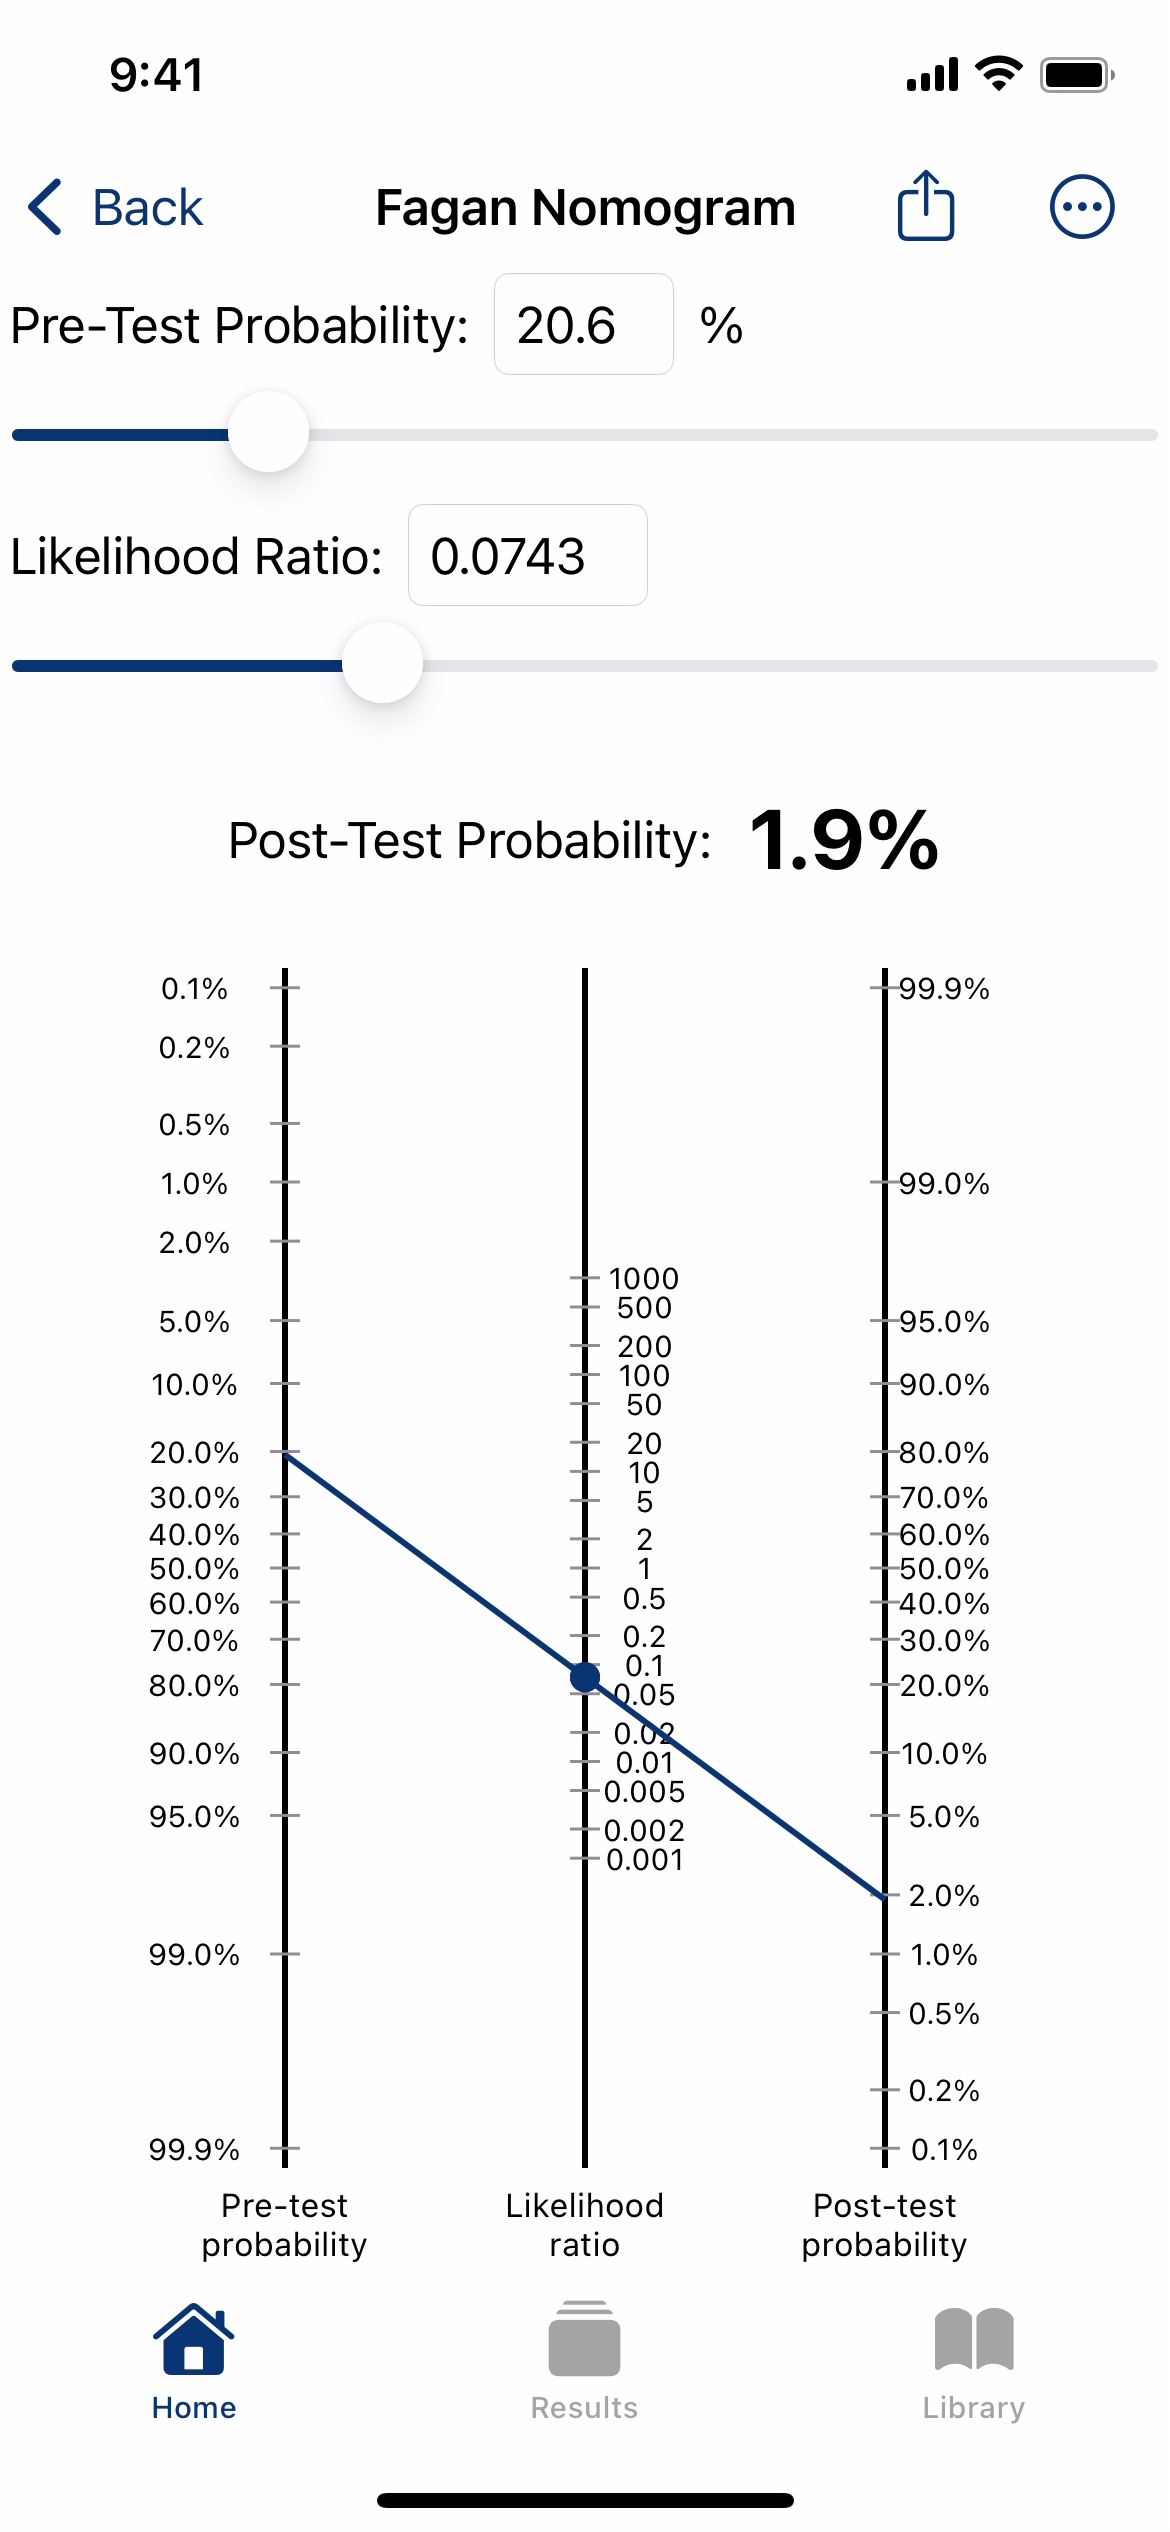
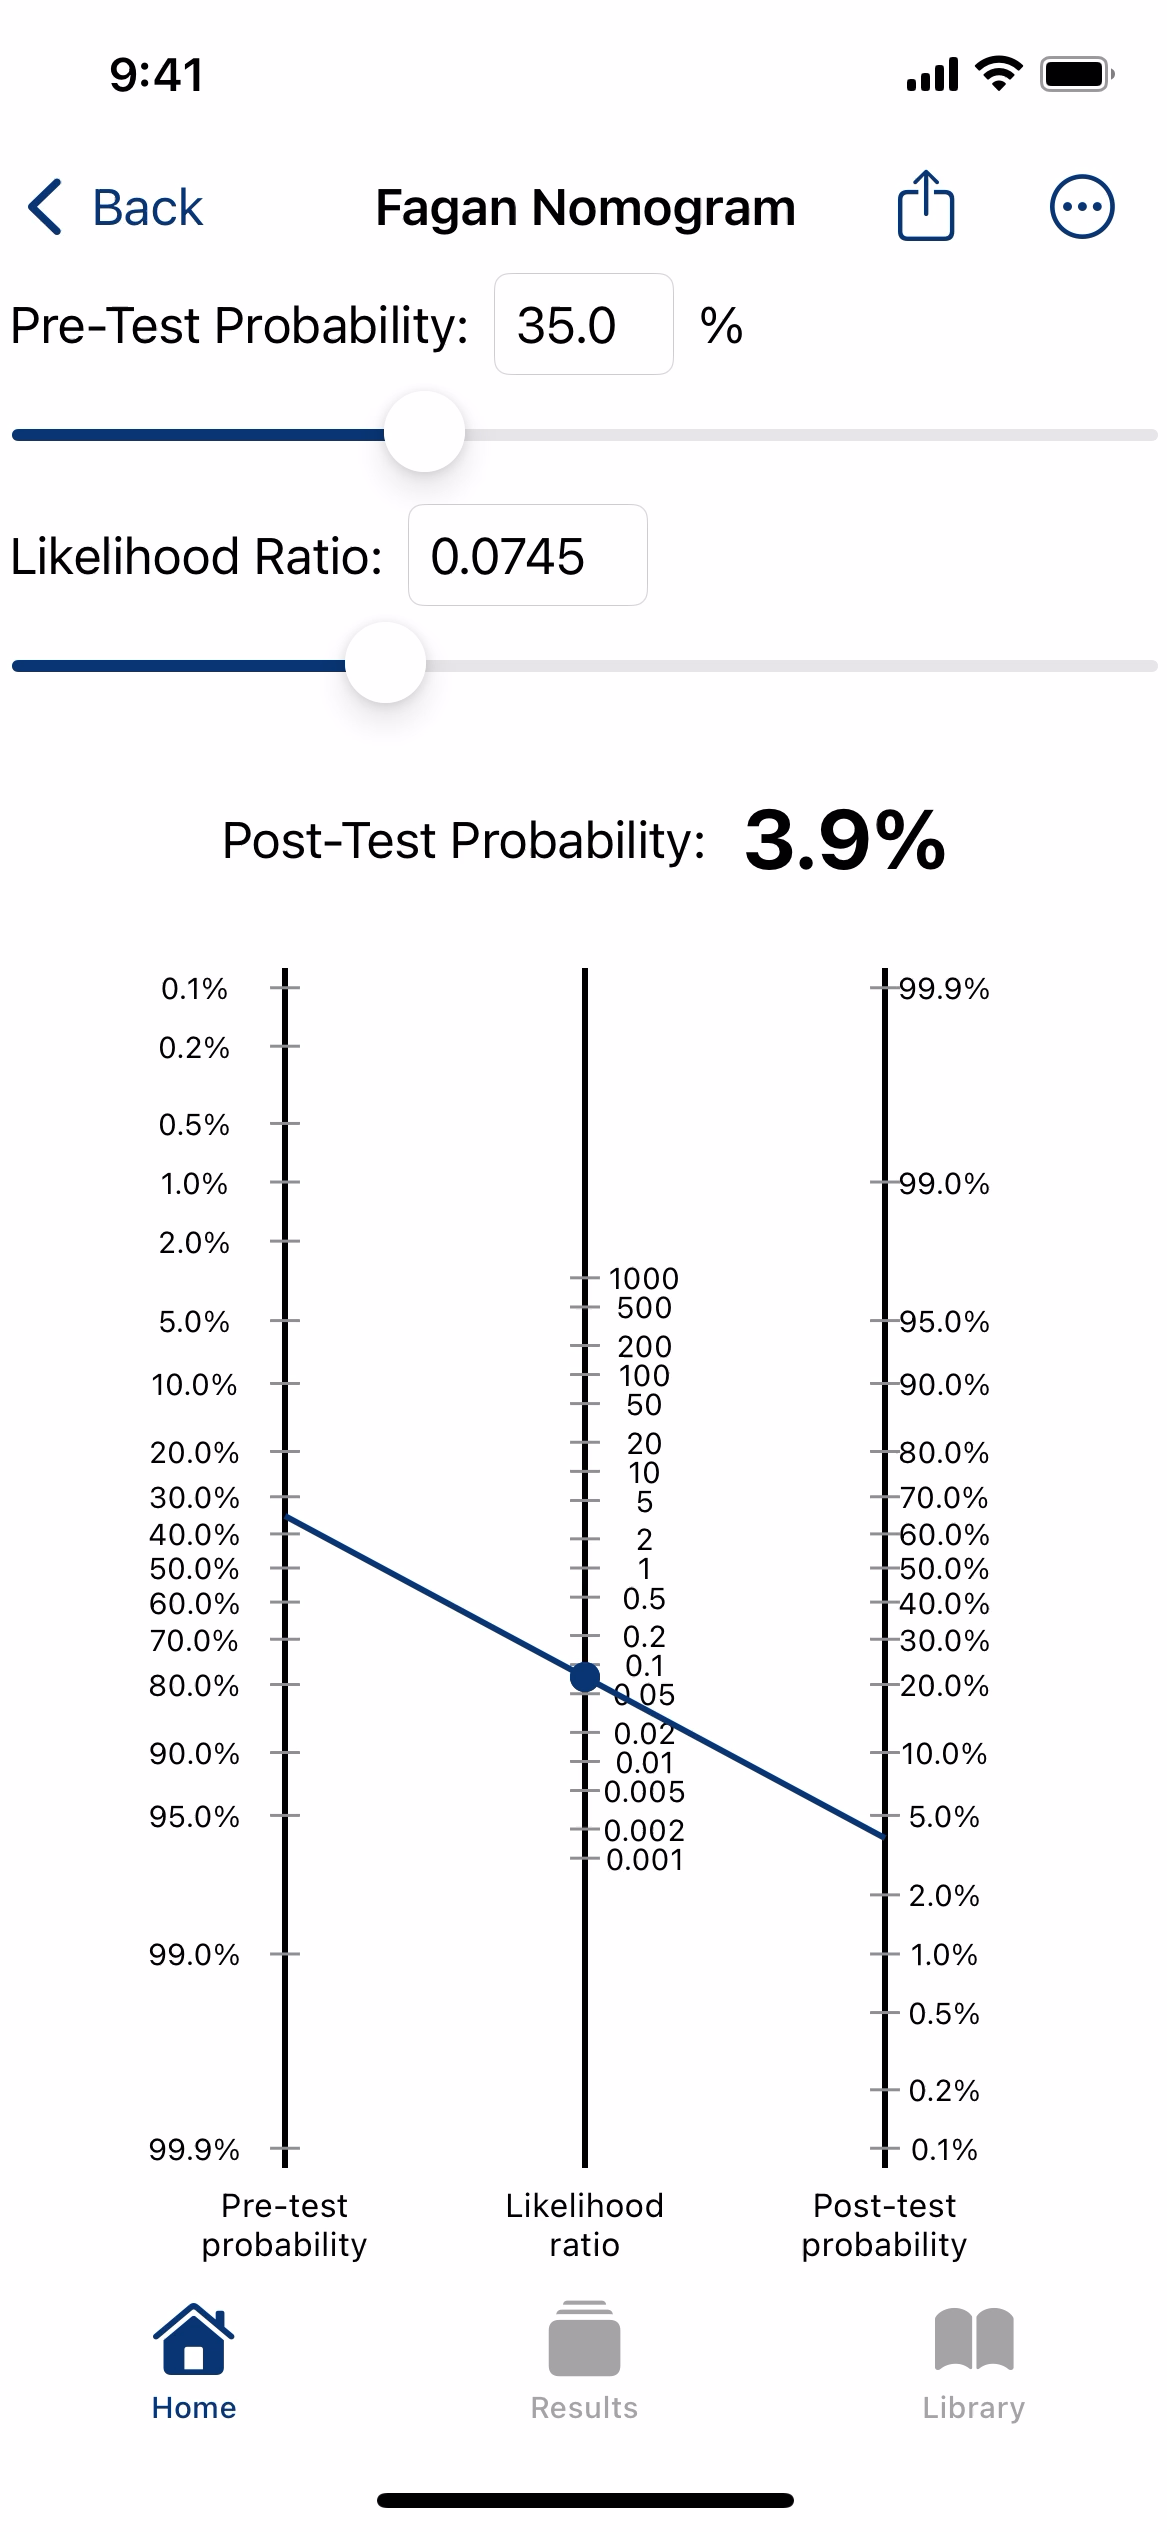
You can see the results as an interactive Fagan Nomogram through the menu button or by pressing the nomogram button. Select either the LR(+) or LR(-) value.
Use the sliders to explore how a change in Pre-Test Probability influences the Post-Test Probability.
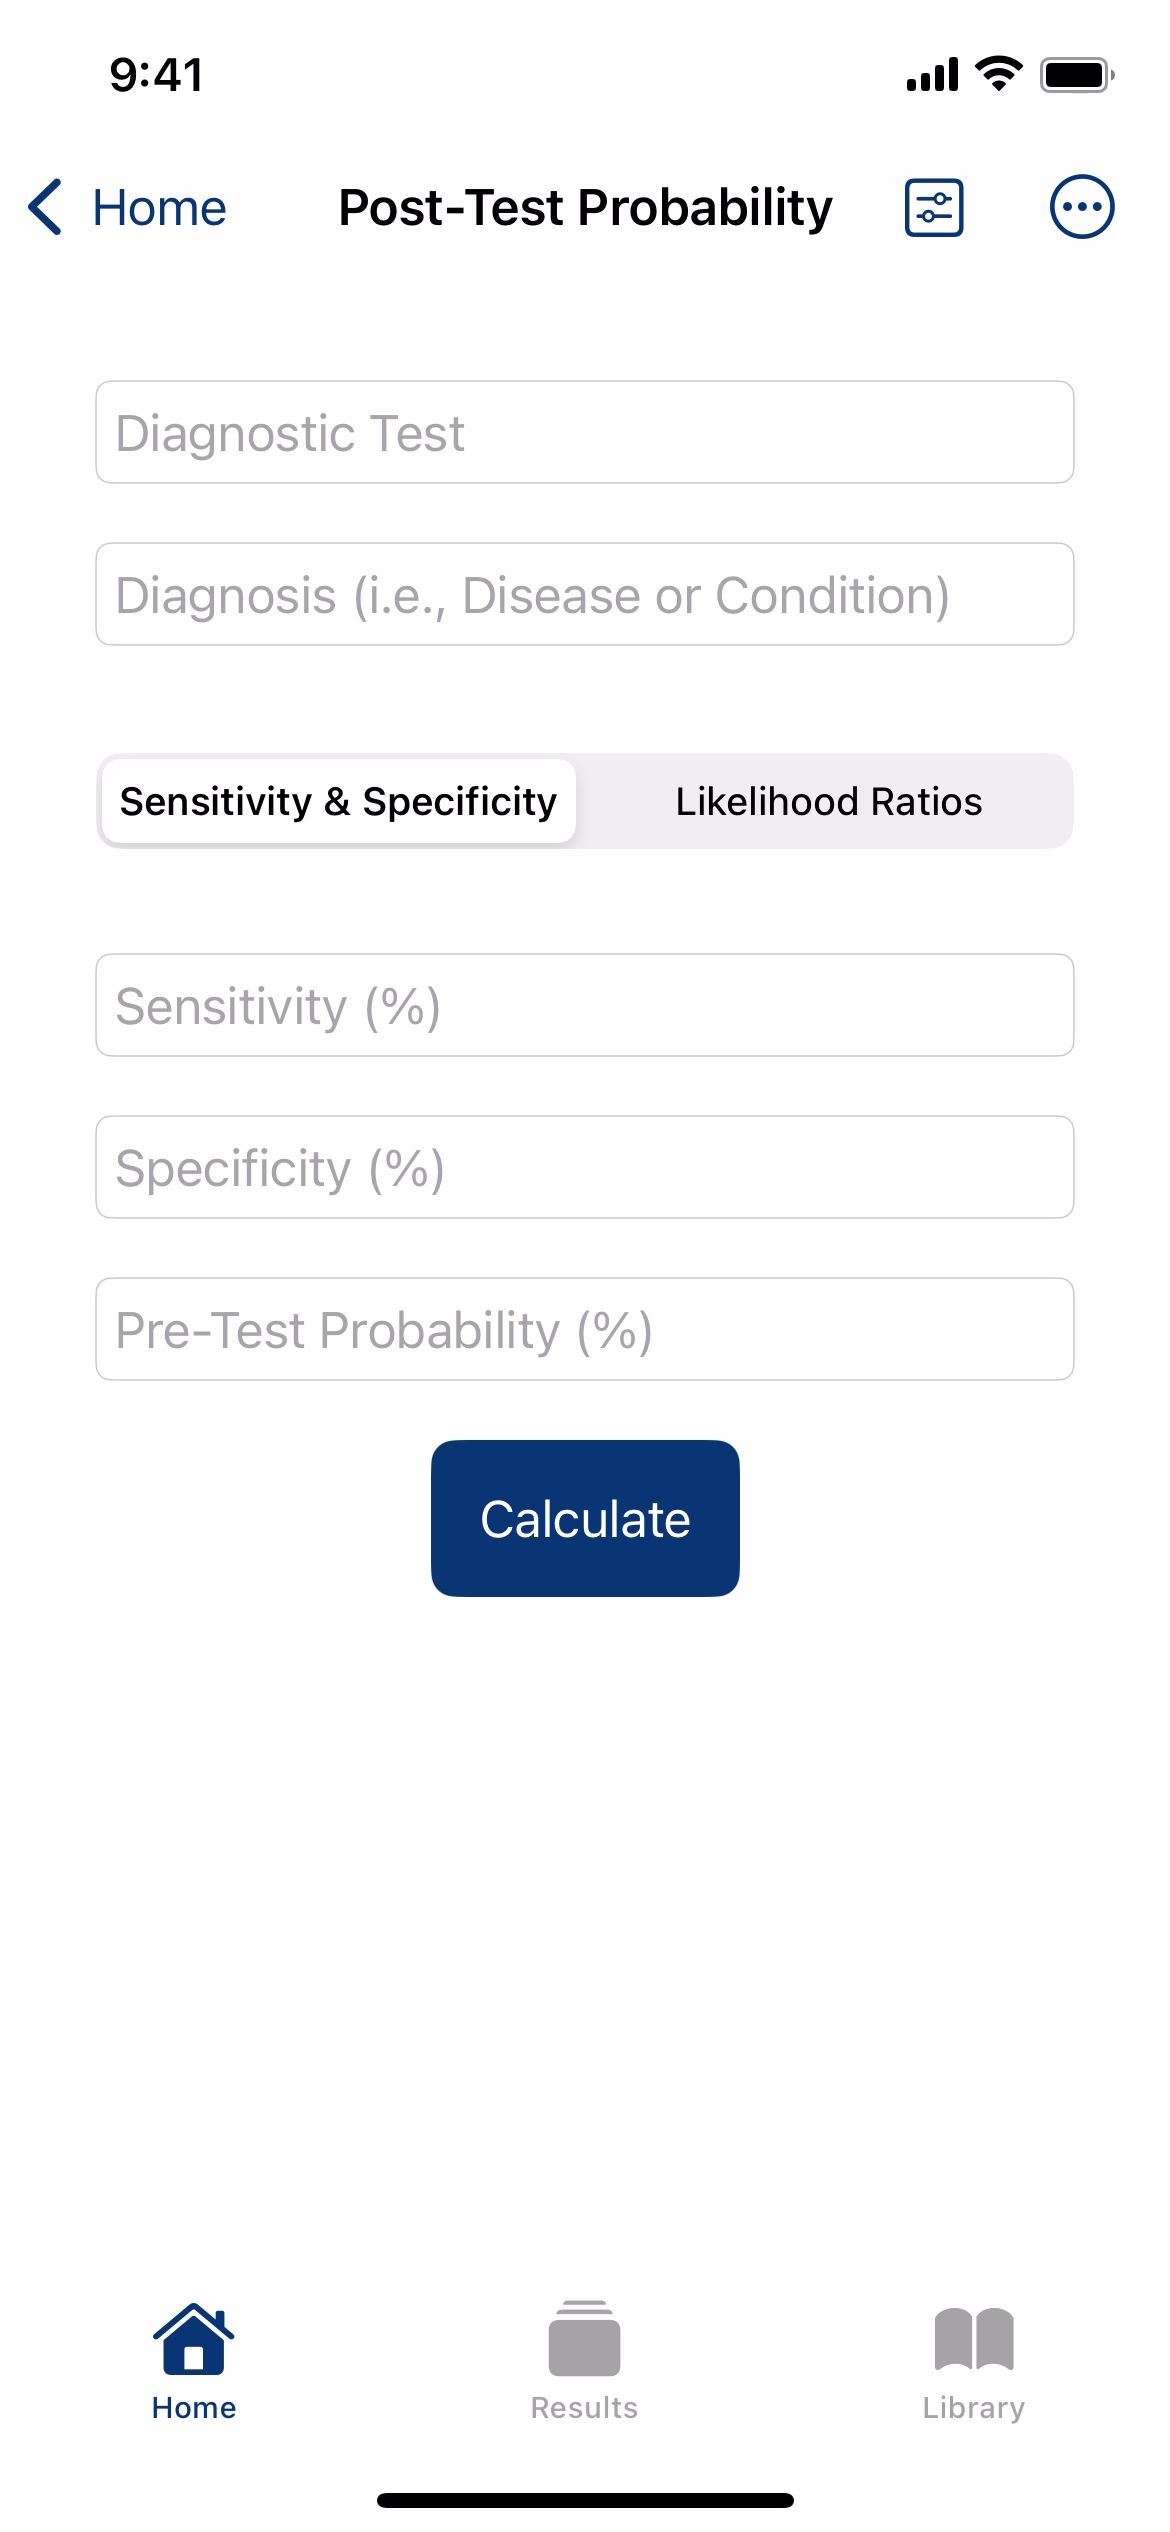
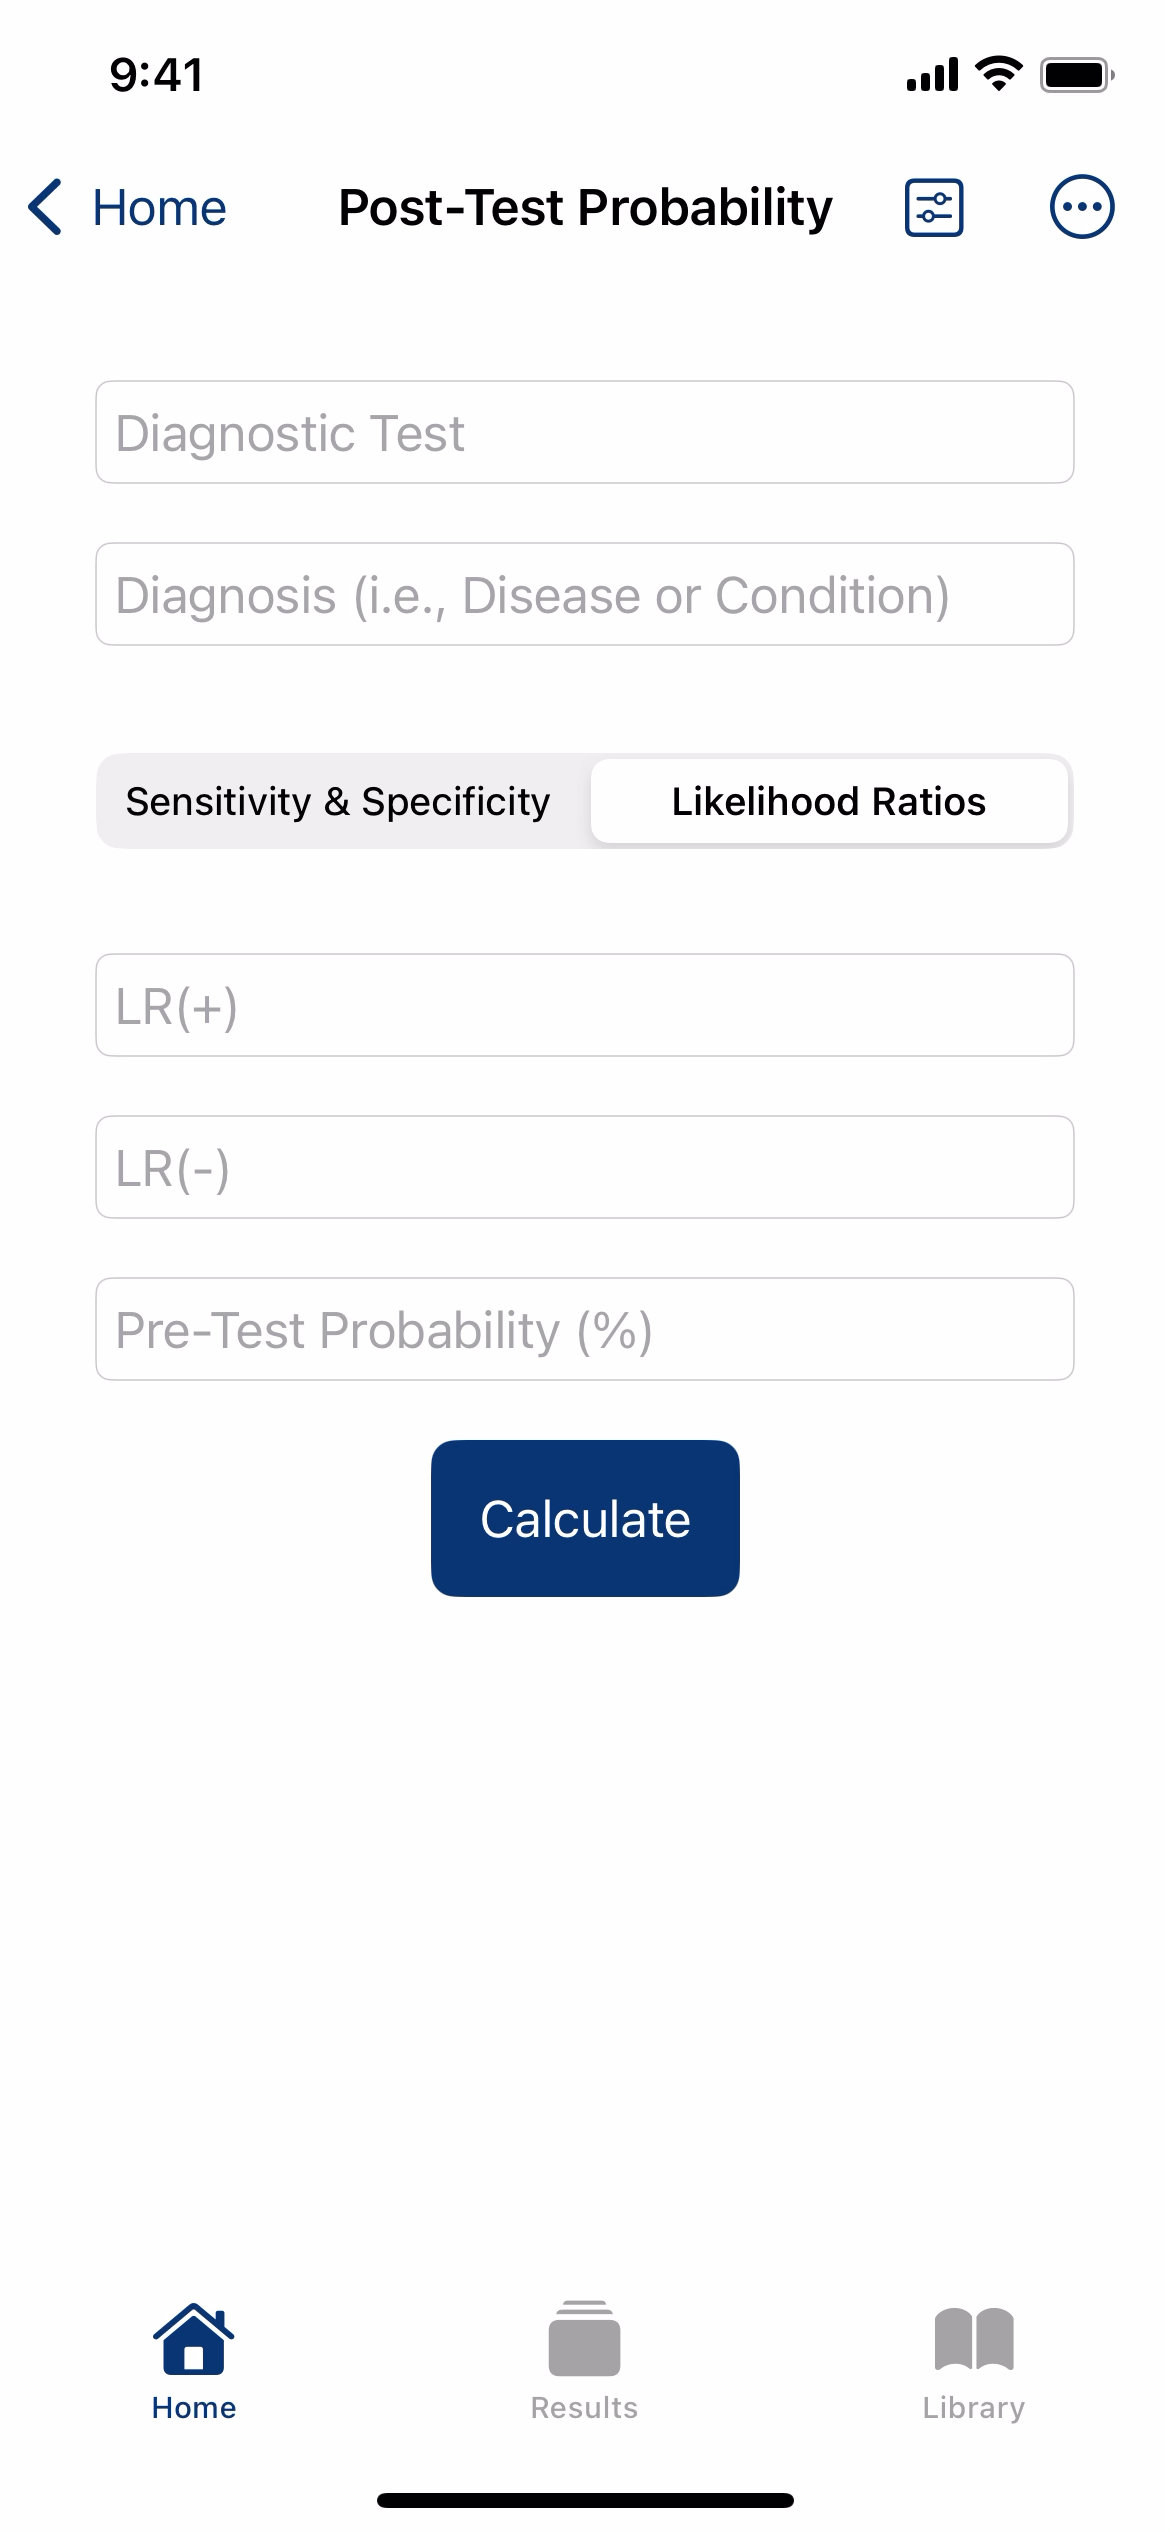
First, select how you would like to input the study data. You can choose from either "Sensitivity & Specificity" or "Likelihood Ratios".
Based on how the authors of this study[2] presented their results in the table below, it would be easiest to use the "Sensitivity & Specificity" input method.
Enter the sensitivity (94.1%) and specificity (79.2%) of the diagnostic test. Next, choose your pre-test probability (often the prevalence of disease or condition in your patient population).
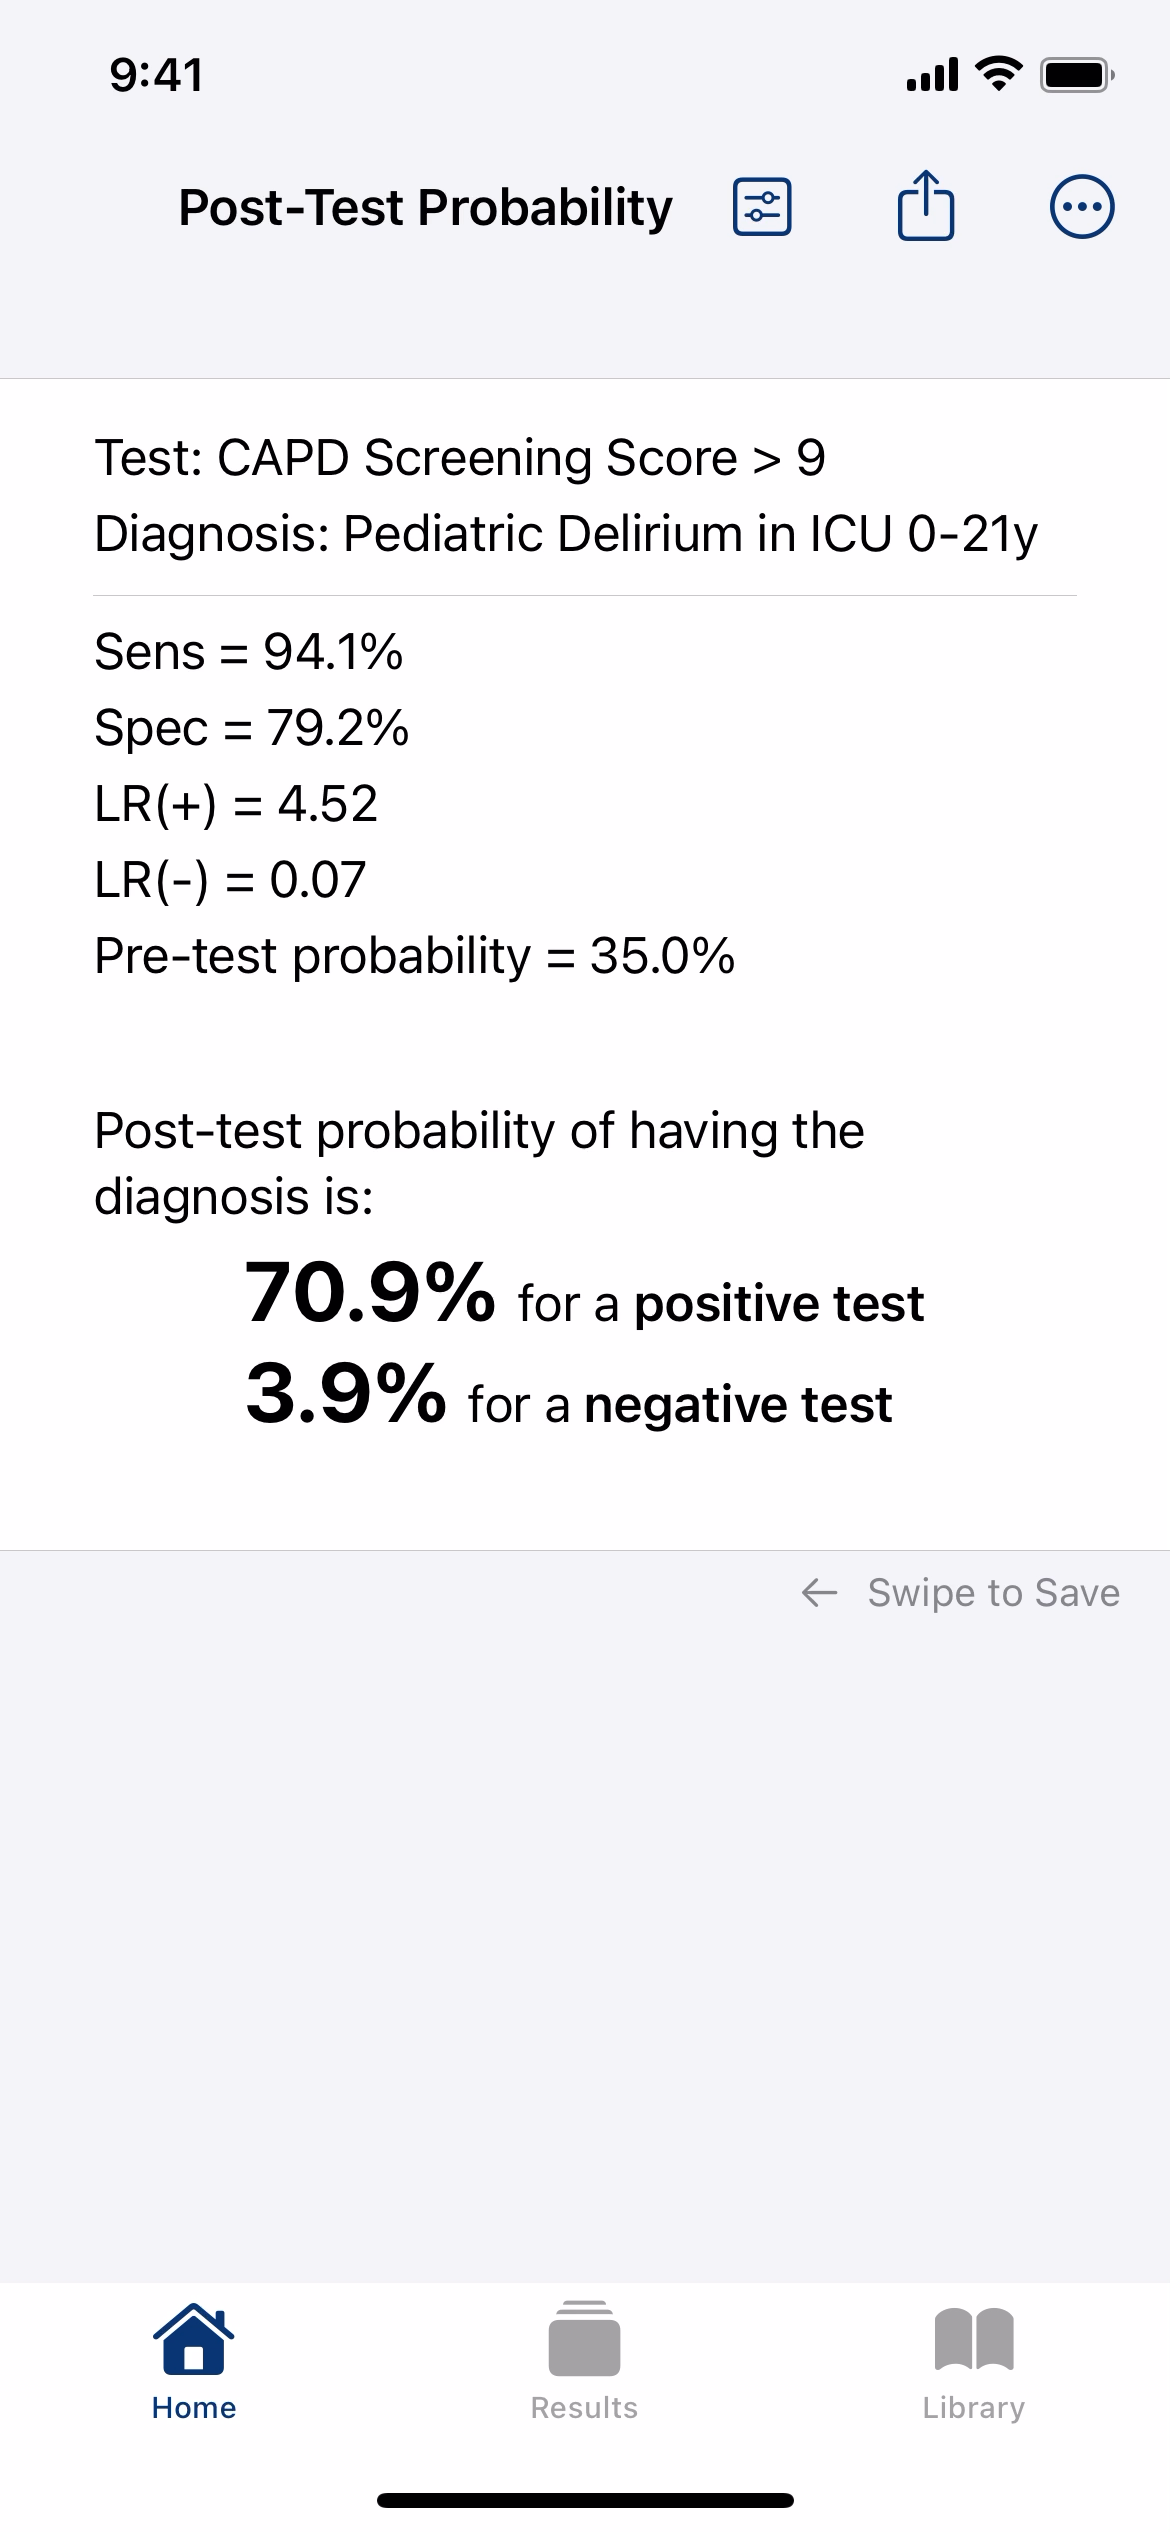
In this example, I chose a pre-test probability of 35%:
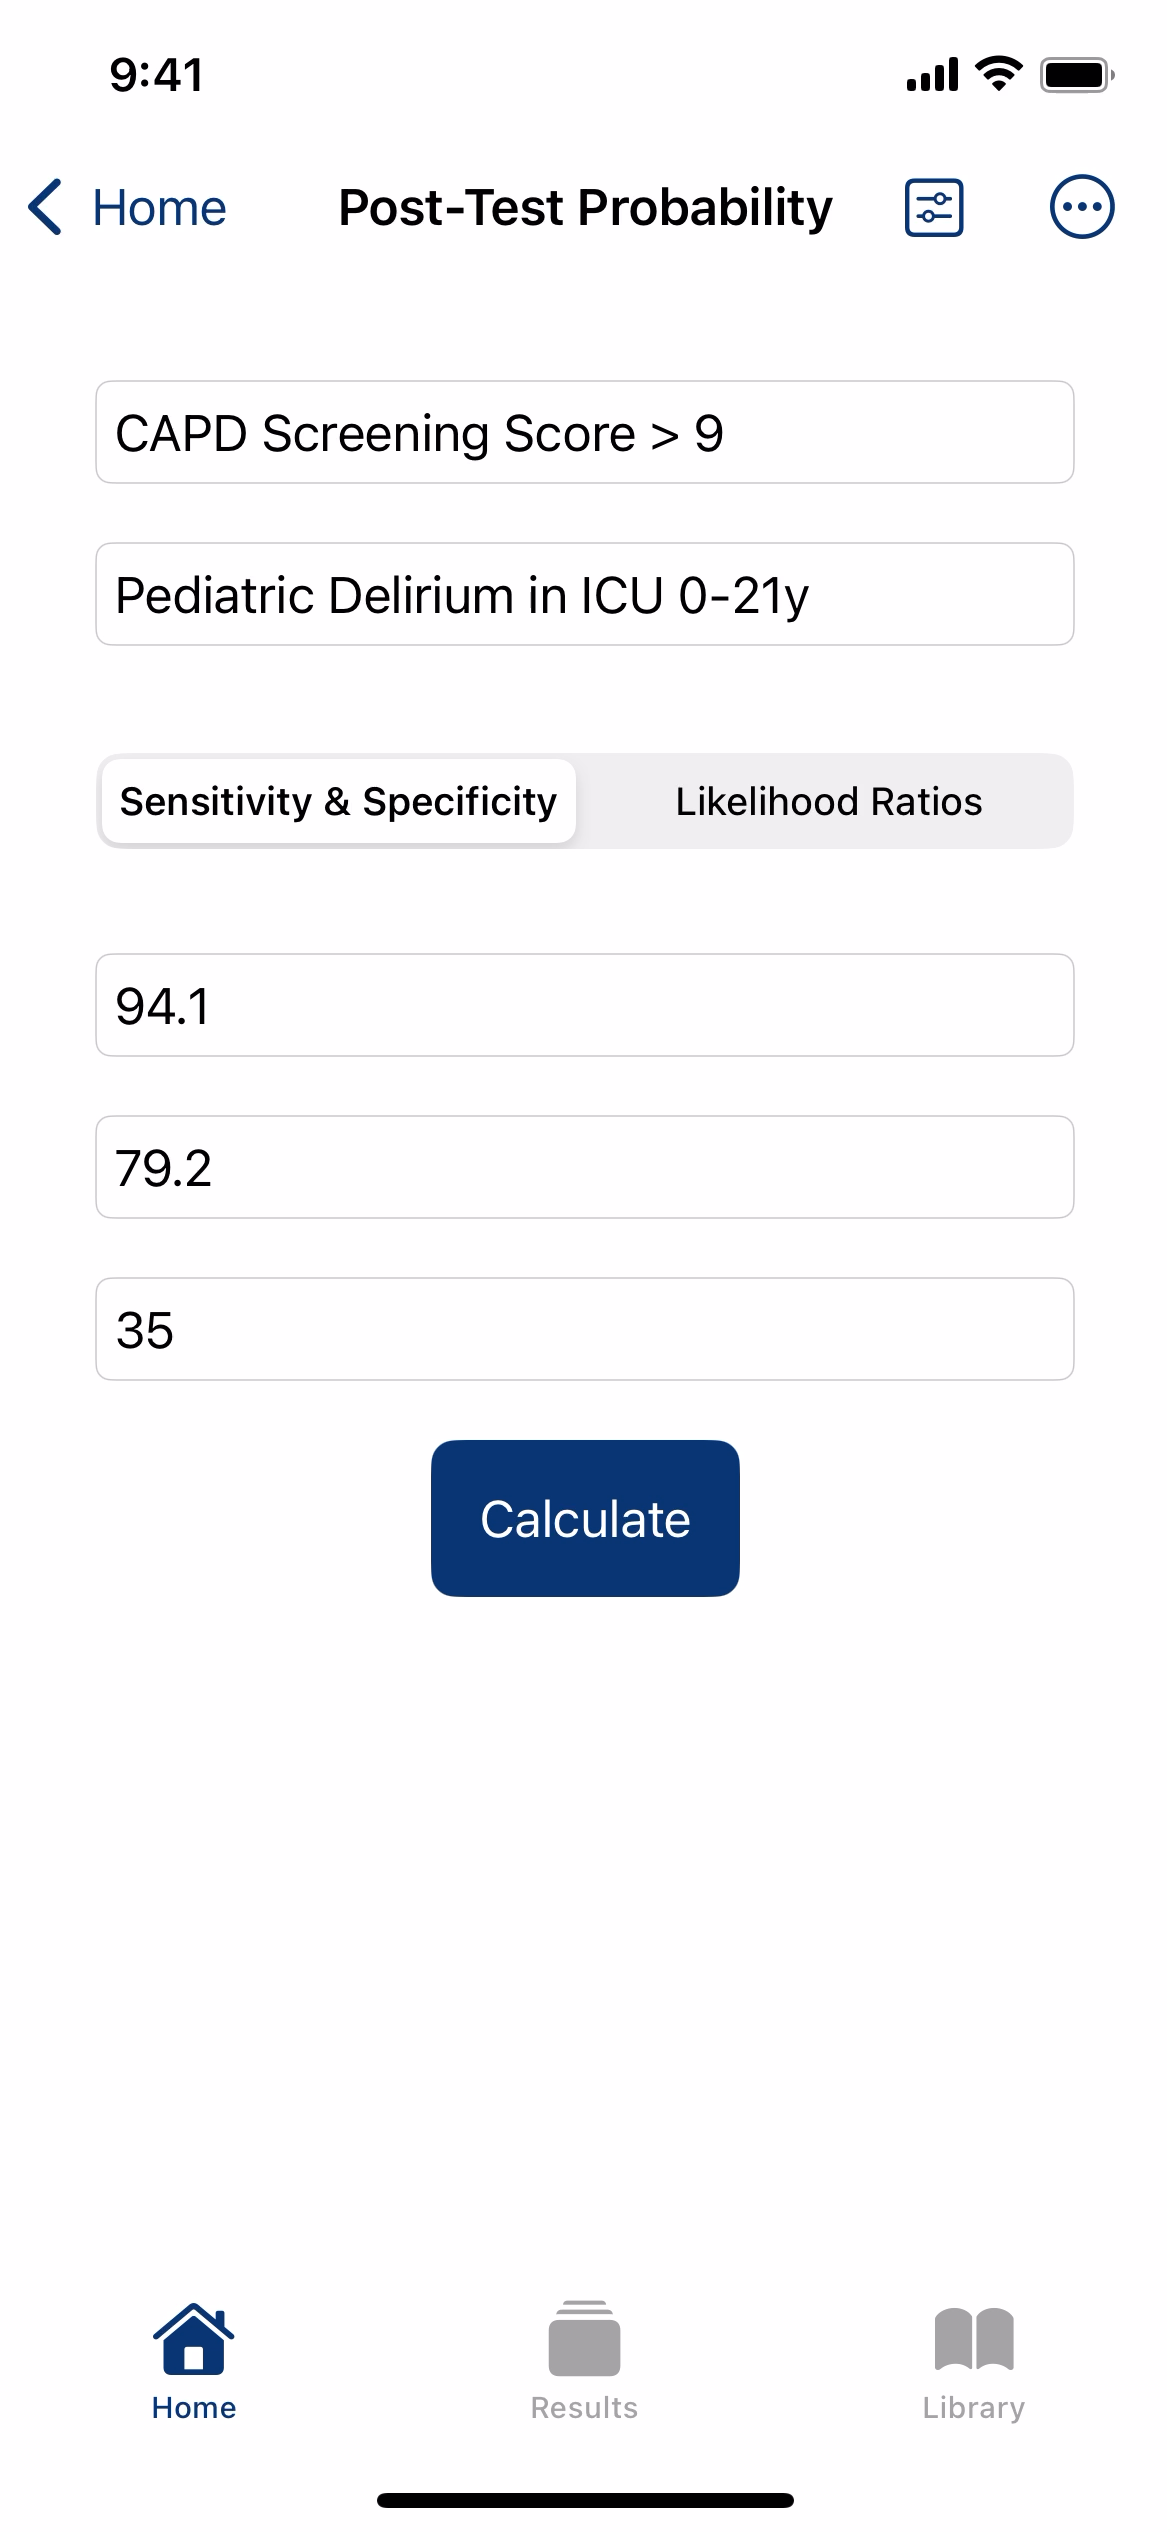
Press the "Calculate" button to see the post-test probabilities for a positive or negative test result.
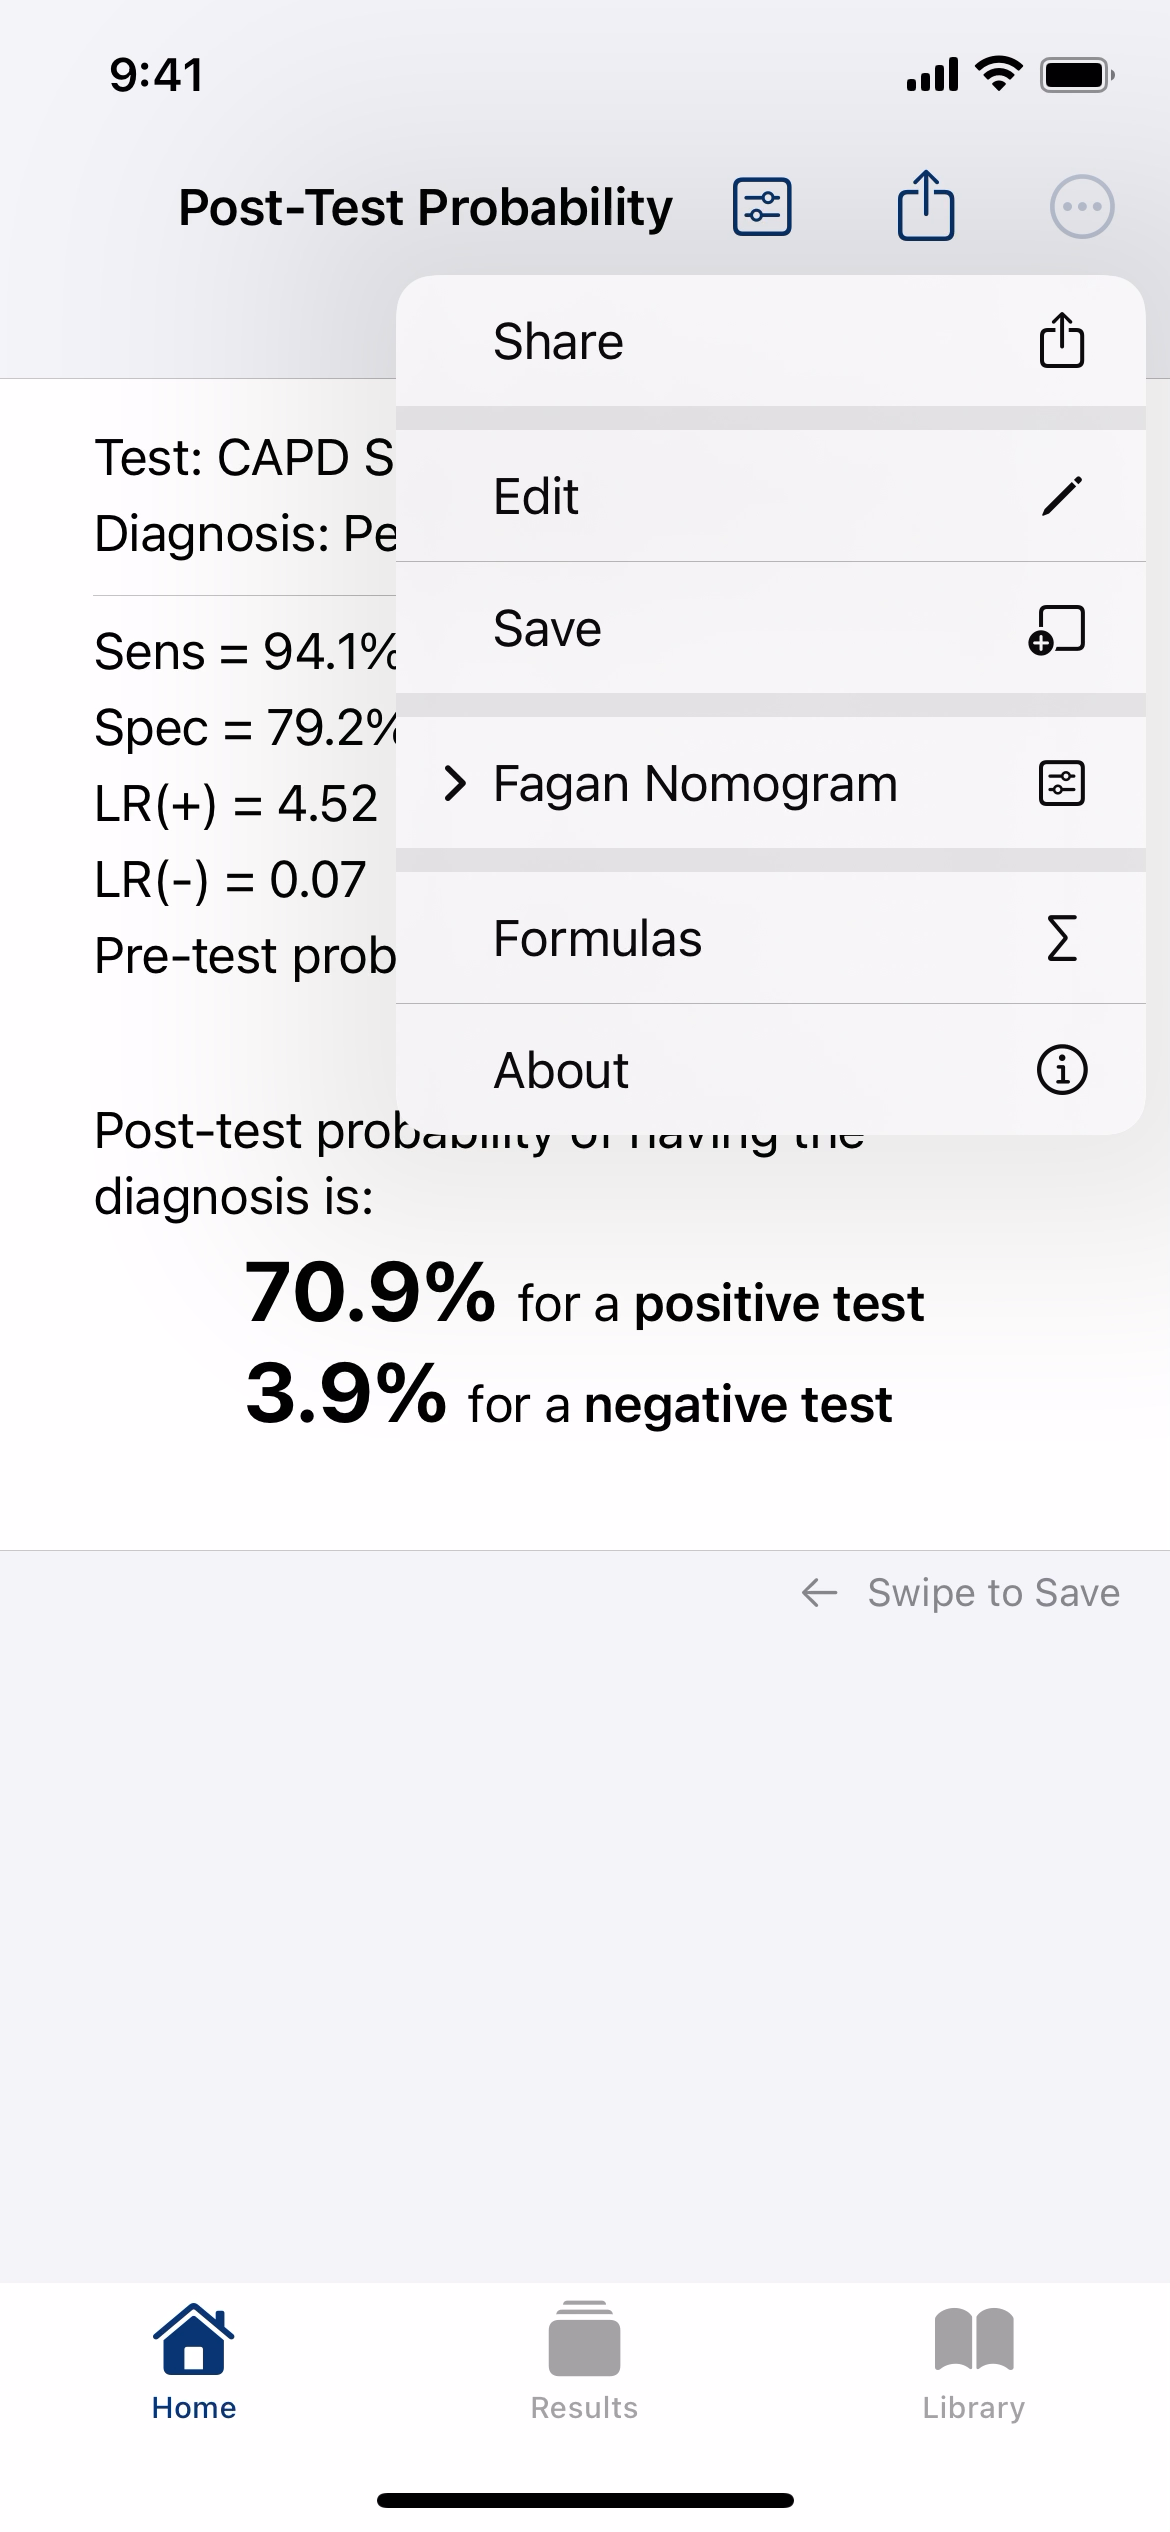
You can also access an interactive Fagan Nomogram through the menu button at the top right...
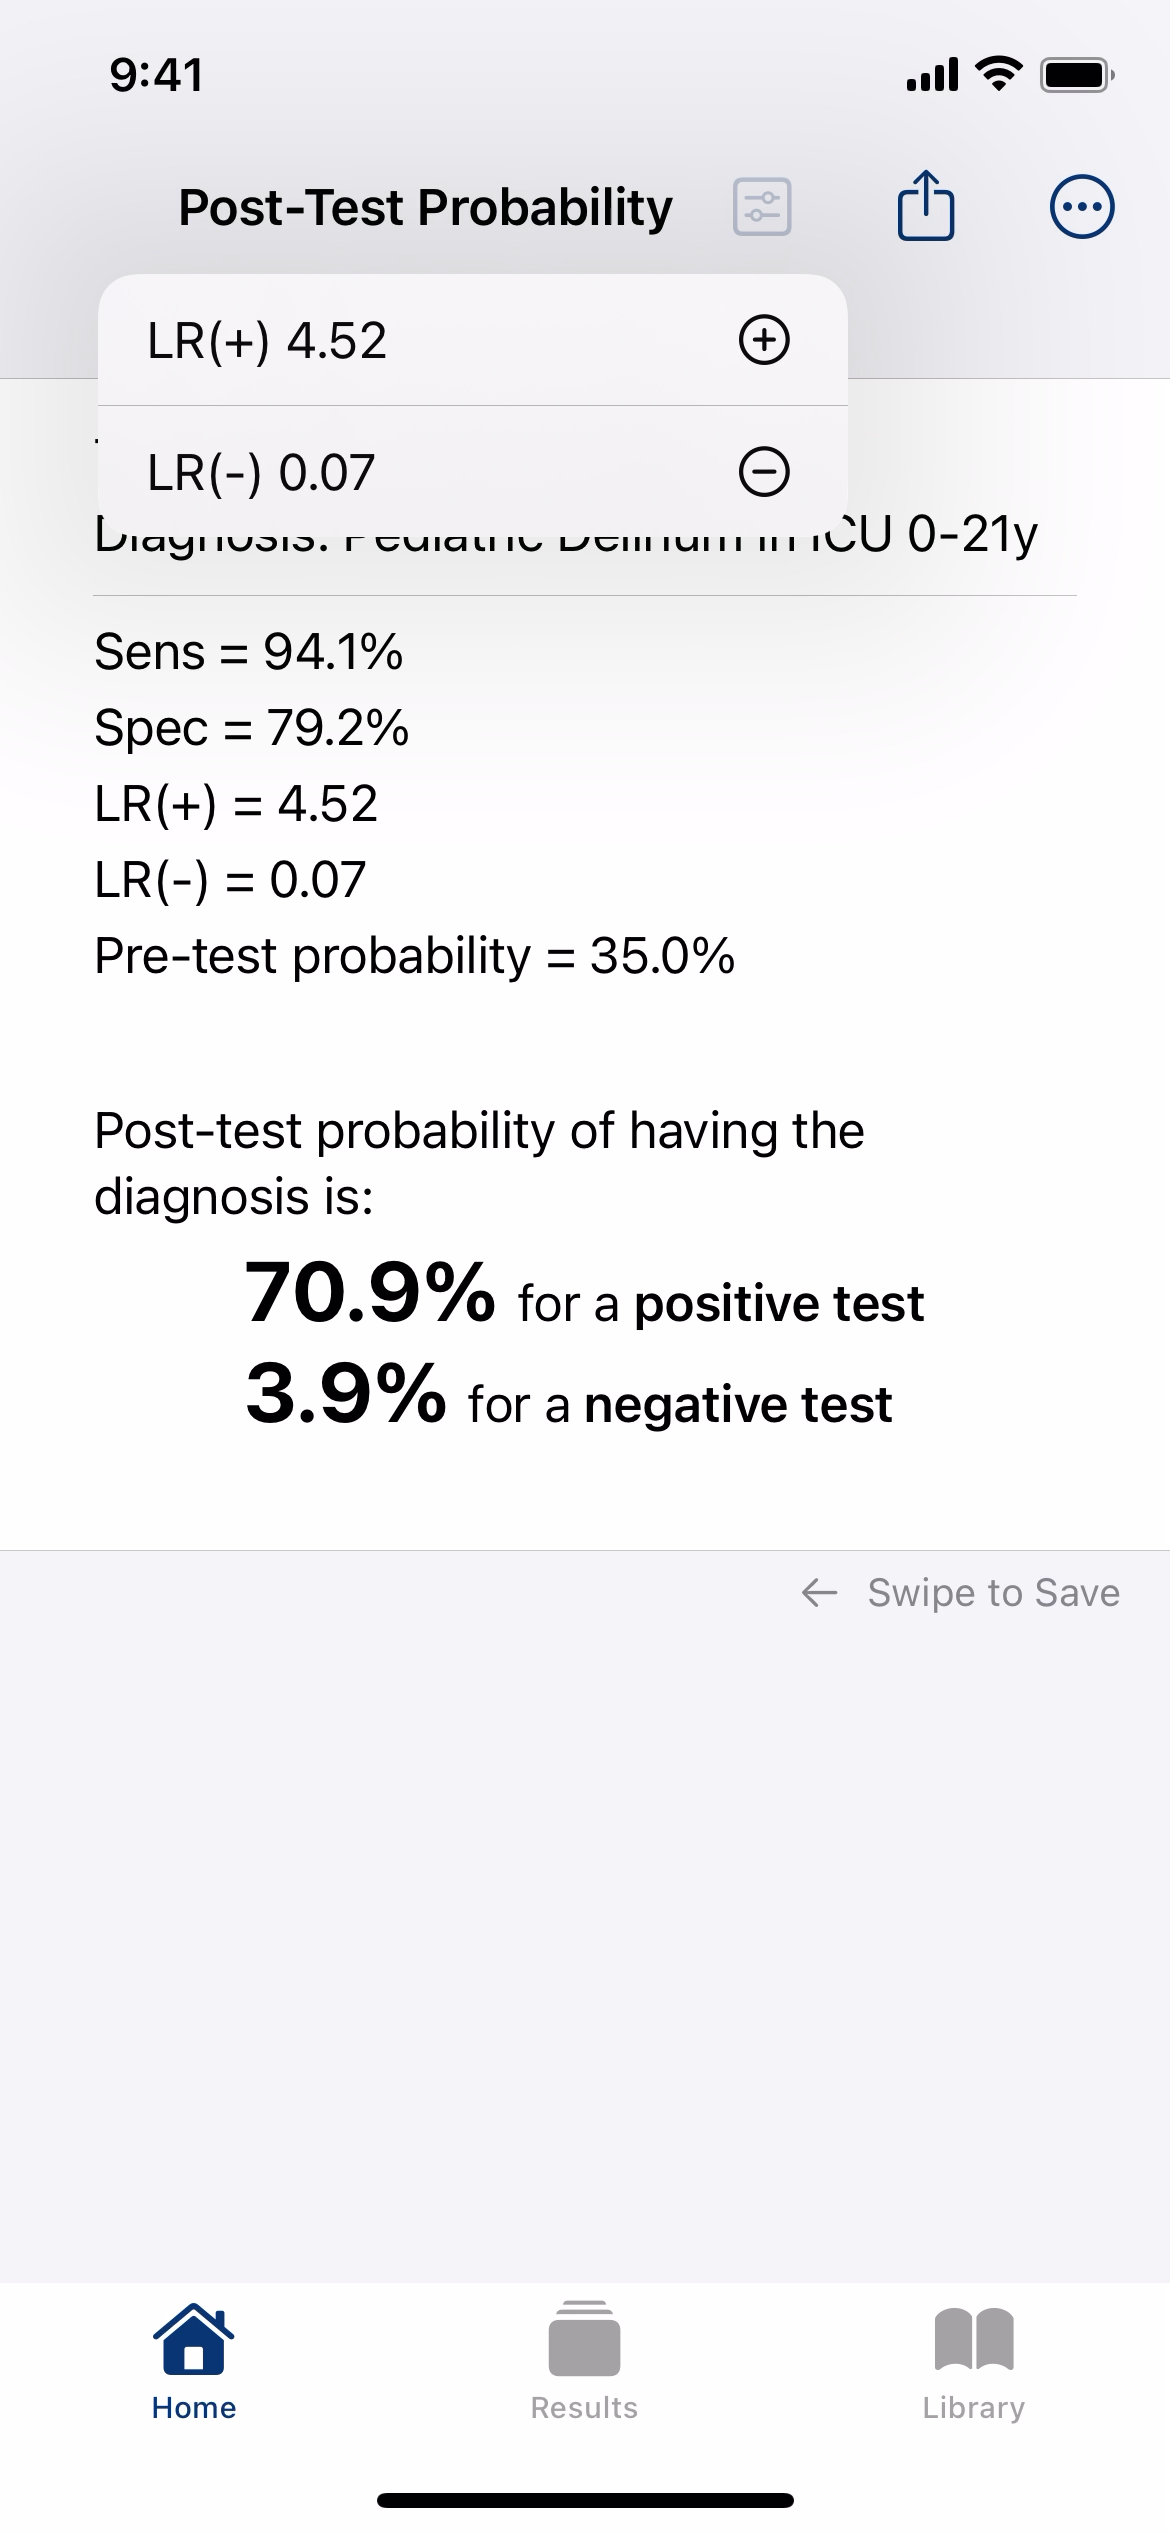
...or by pressing the nomogram button and selecting either the LR(+) or LR(-) value.
Use the sliders to explore how changes in Pre-Test Probability and Likelihood Ratio influence the Post-Test Probability.
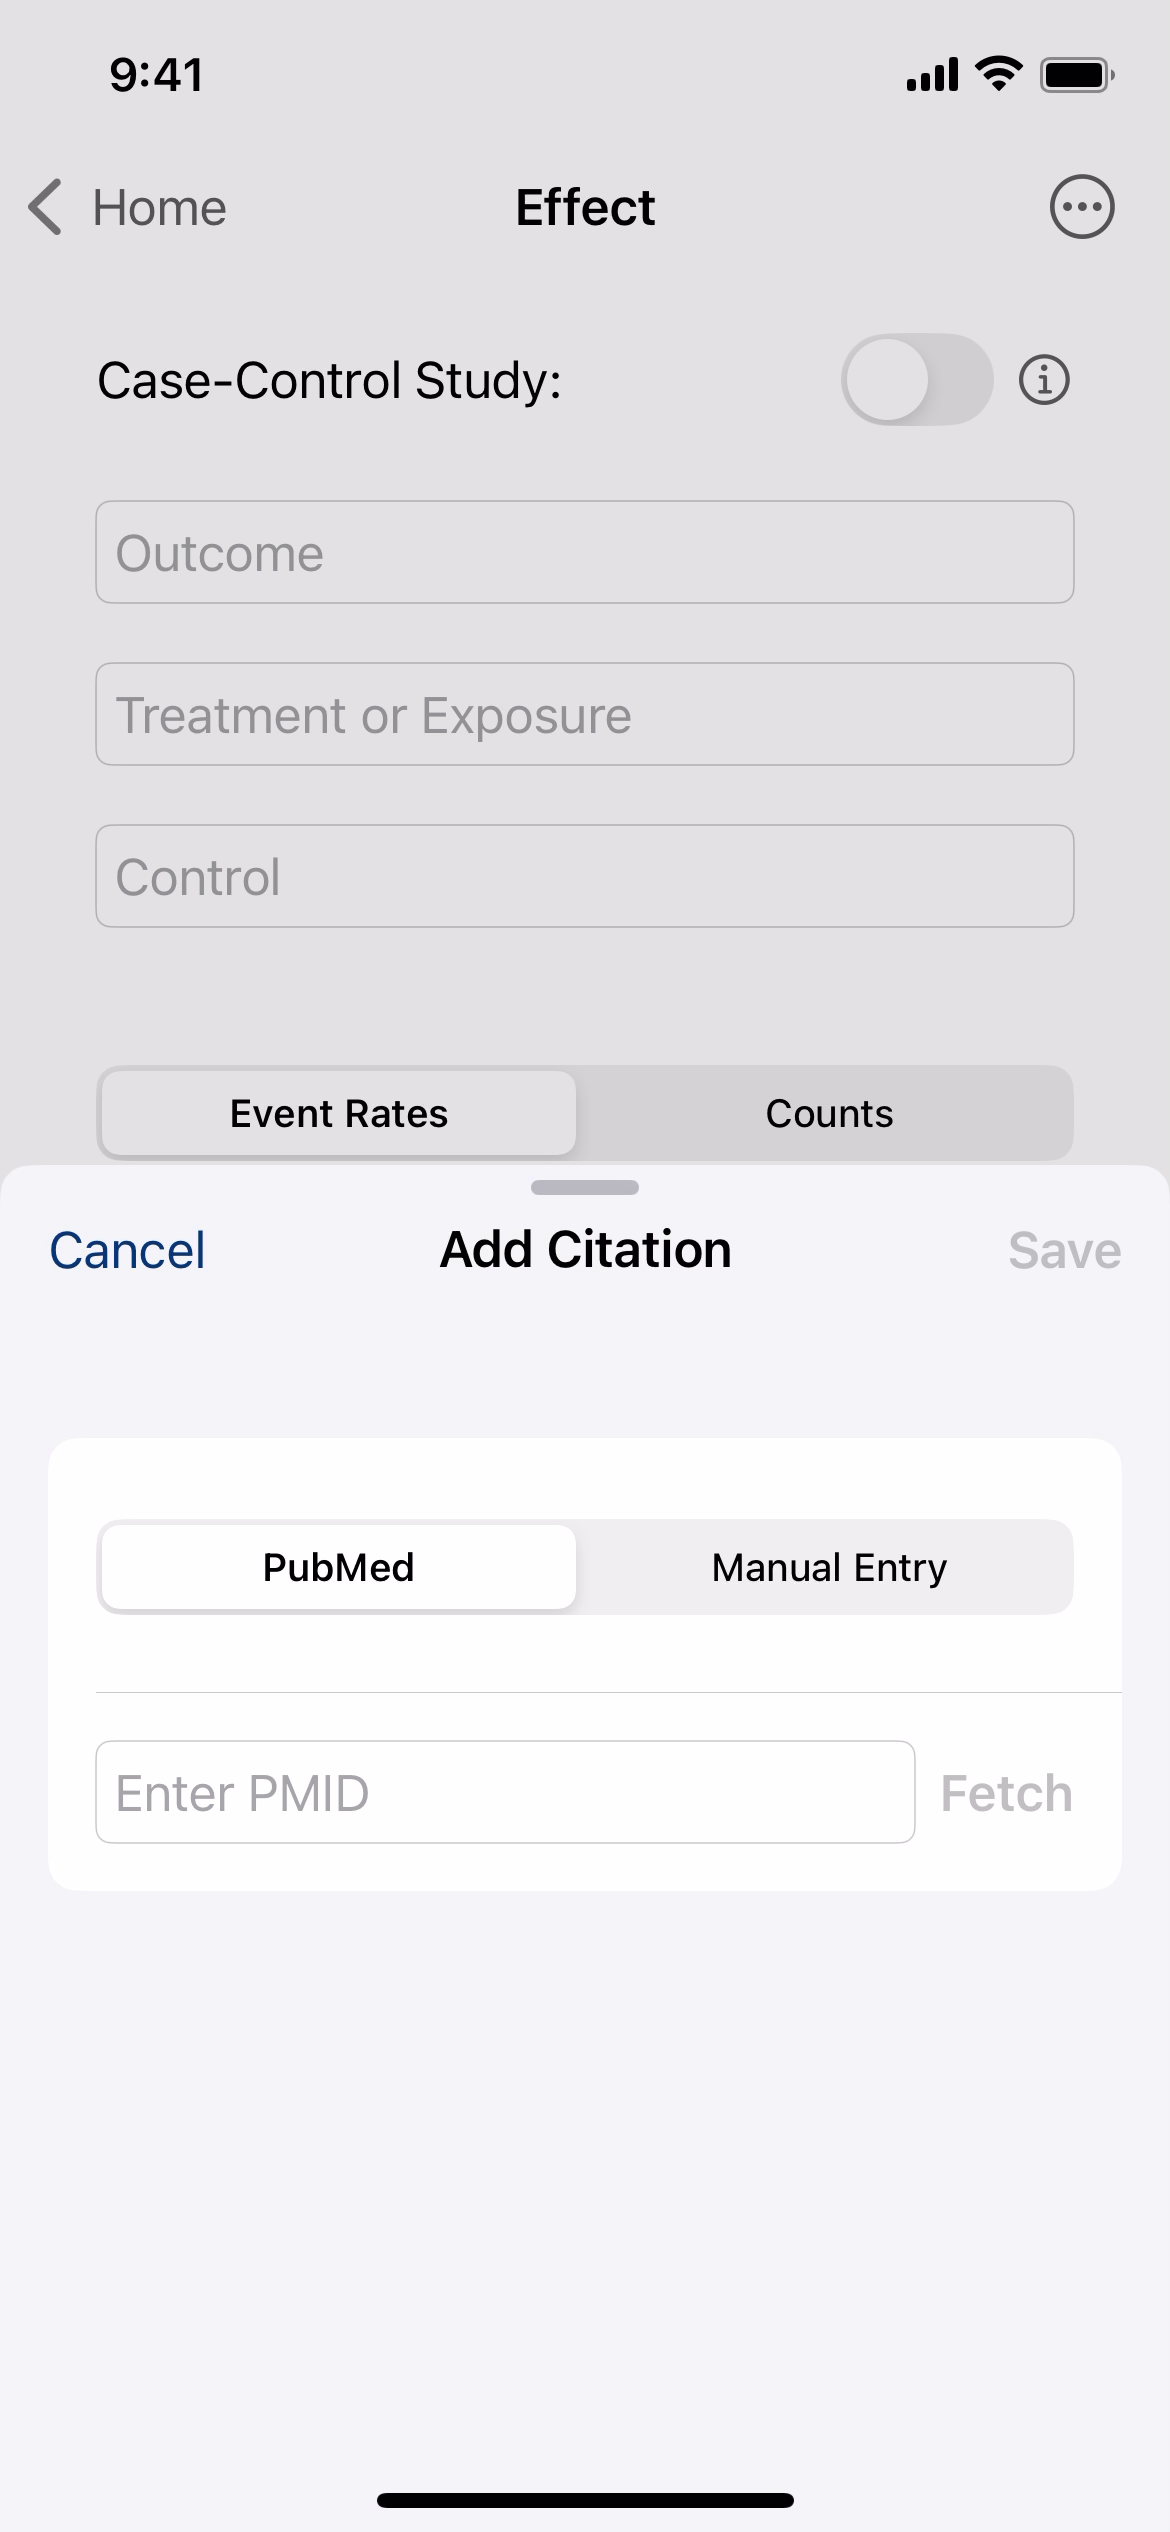
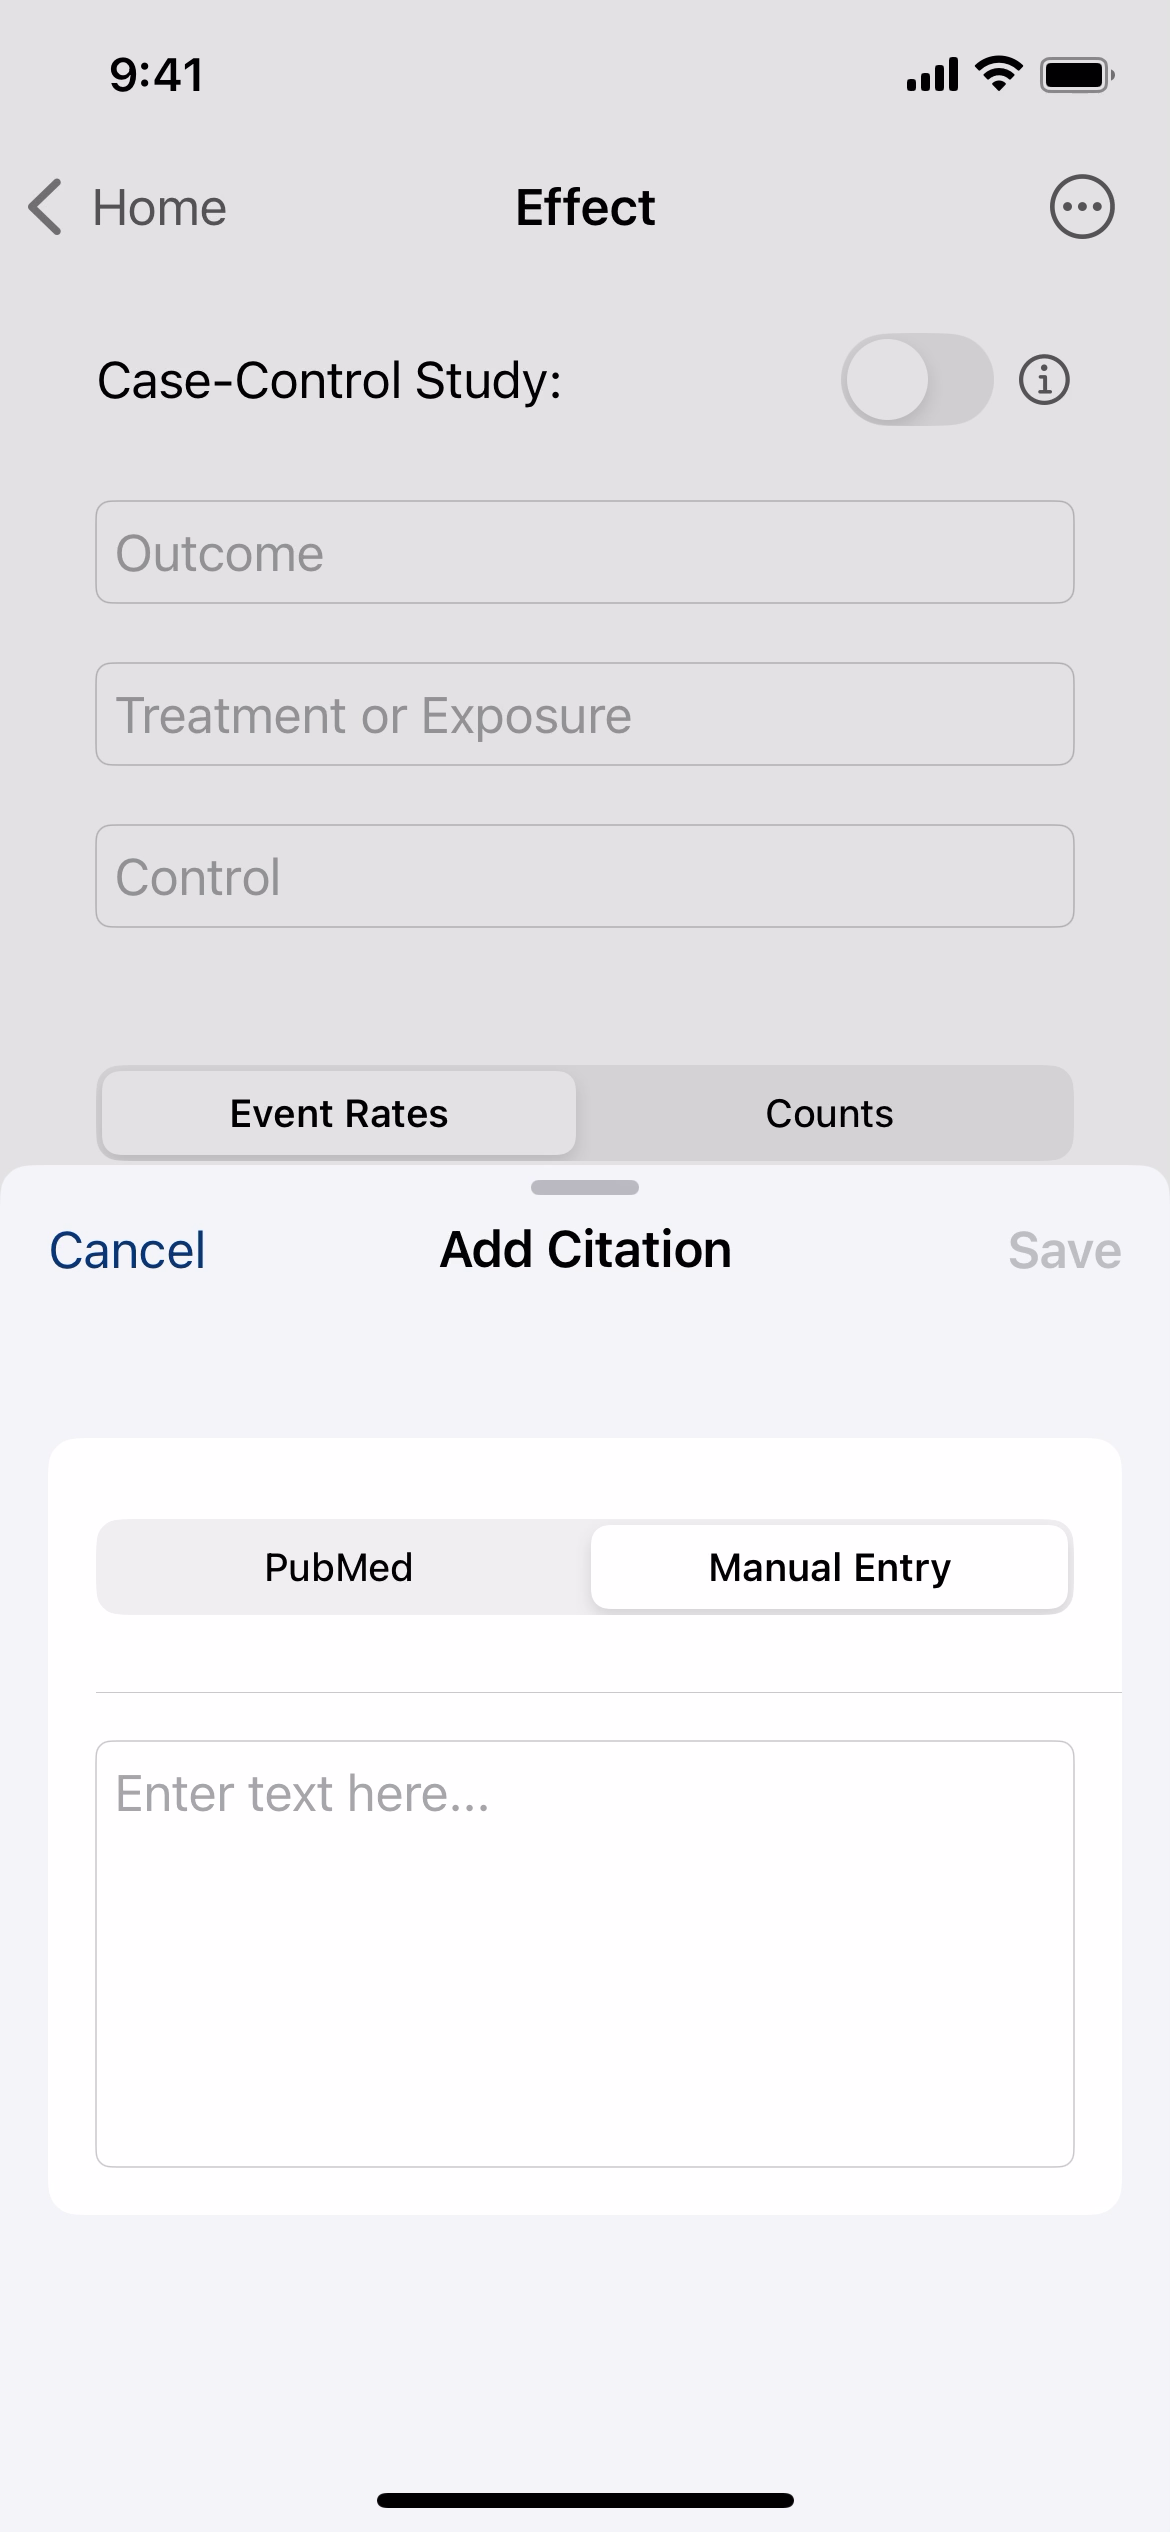
Every calculator has the option to add a citation at the bottom by pressing "Add".
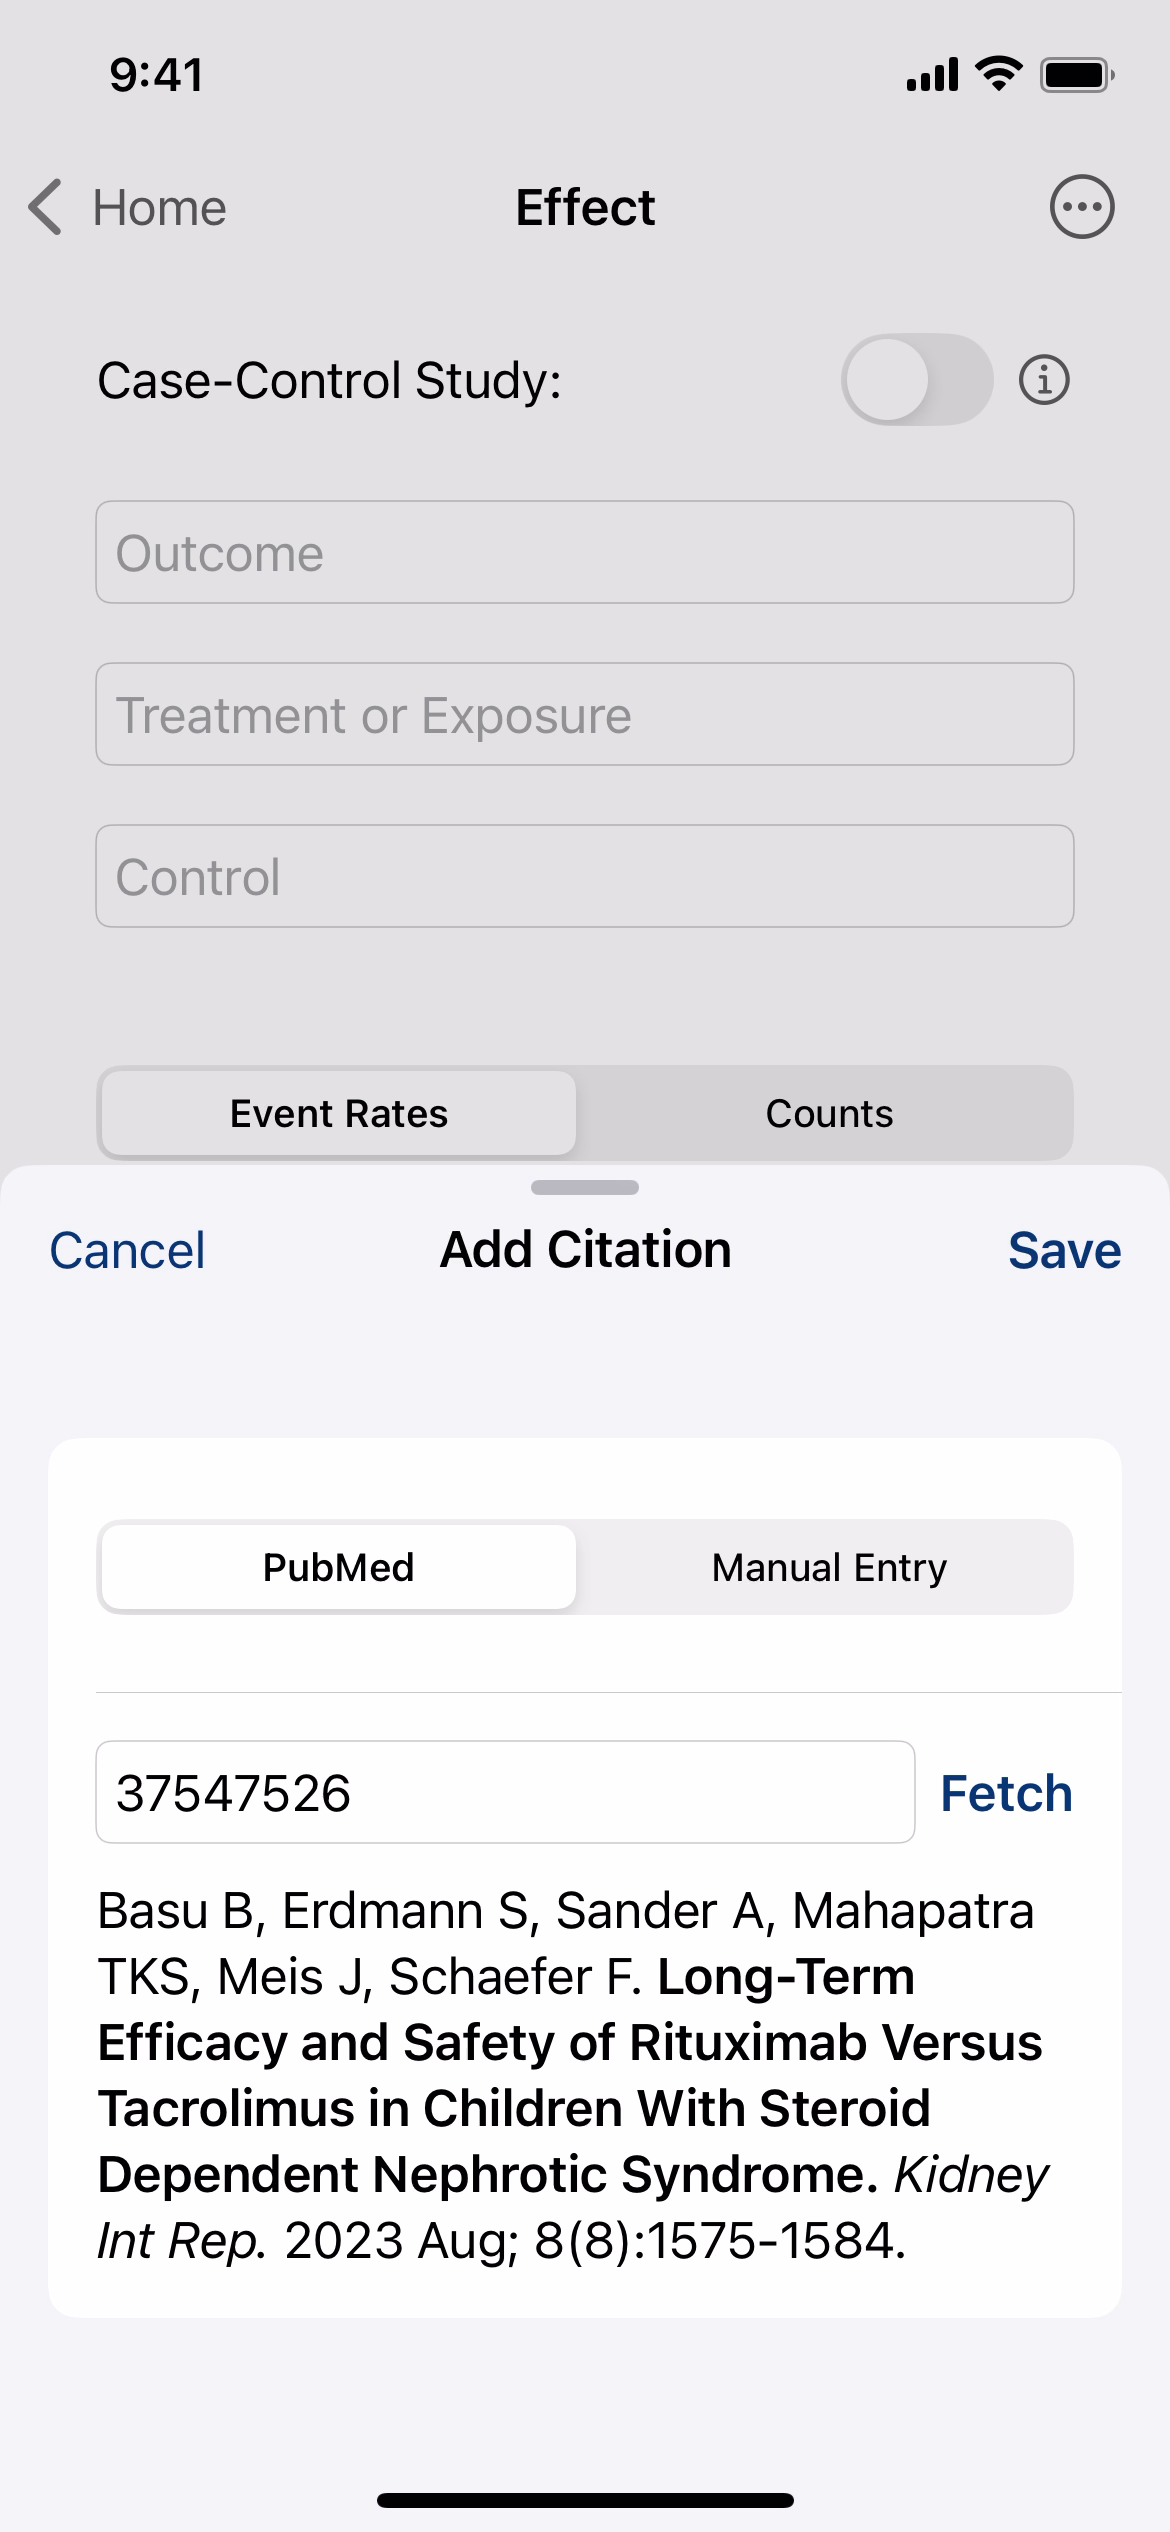
Enter a PMID to fetch the citation from PubMed, or enter it manually.
After saving the citation, you can edit or remove it from within the calculator.
A condensed citation will display below the results.
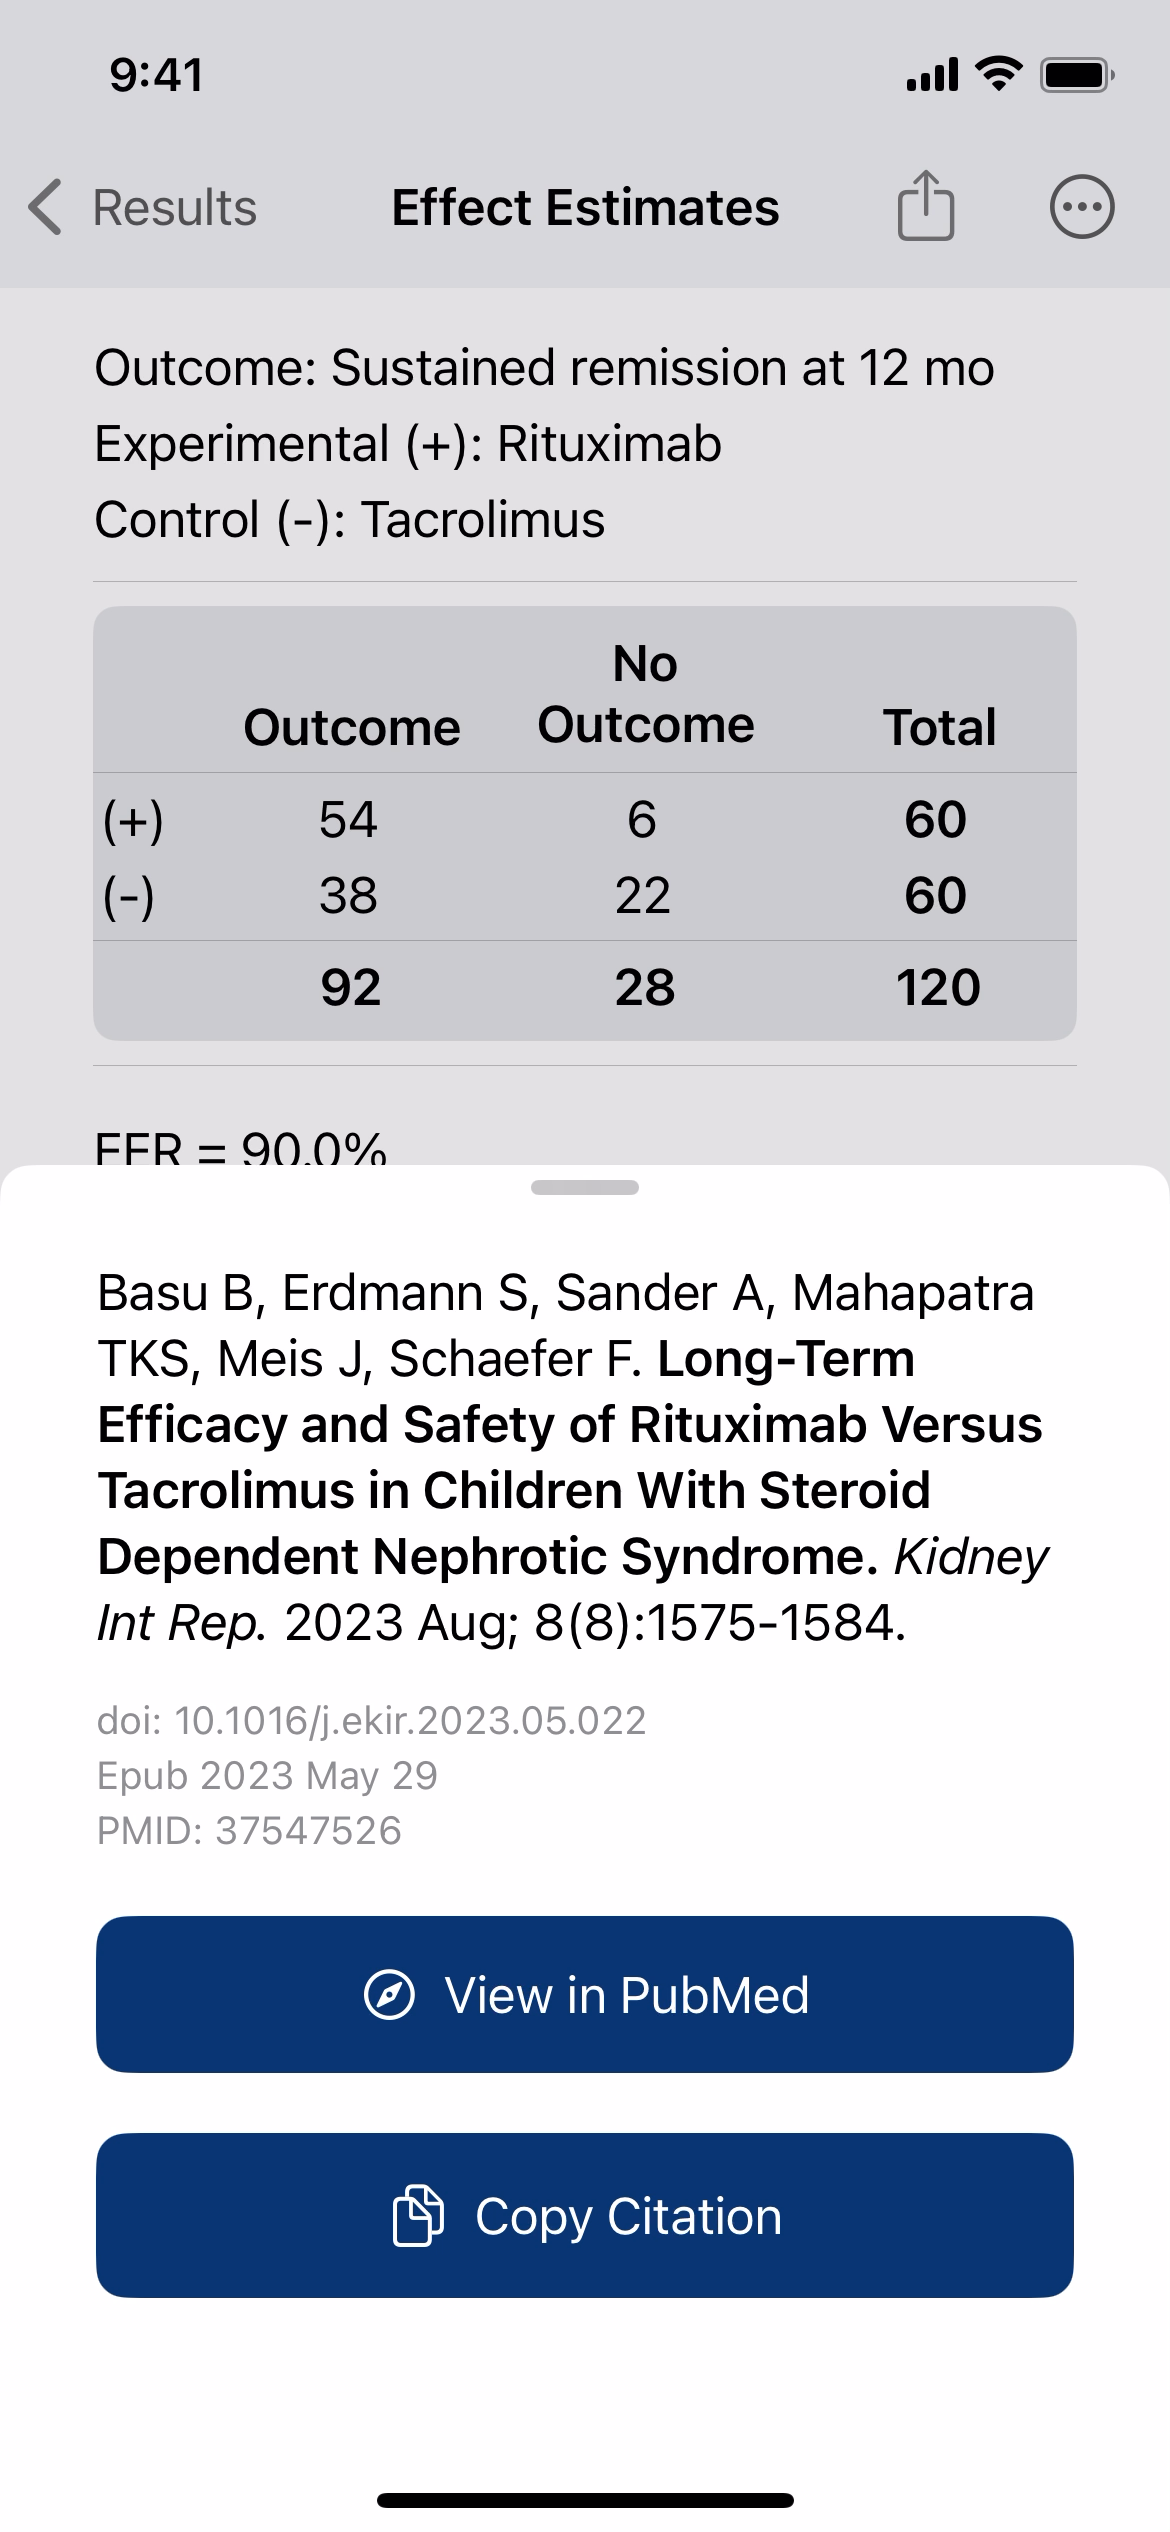
Tap any citation to view the full details, open it in PubMed, or copy the citation to your clipboard.
Click on the Results tab to view up to 100 of your saved results. You can press and drag to rearrange, or click a result to view it individually.
Swipe right on a result to email, message, print, or export.
Swipe left to edit the original inputs or to delete the result.
Press the menu button to see more options.
Use the Search function to filter results by keyword.


